In this tutorial we want to learn about TKinter Matplotlib Legends, we are going to learn how you can add legends to your matplotlib graphs in tkinter. we have already learned that how you can embed matplotlib graphs in tkinter.
This is the complete code for this lesson.
|
1 2 3 4 5 6 7 8 9 10 11 12 13 14 15 16 17 18 19 20 21 22 23 24 25 26 27 28 29 30 31 32 33 34 35 36 37 38 39 40 41 42 43 44 45 46 47 48 49 50 51 52 53 54 55 56 57 58 59 60 61 62 63 64 65 66 67 68 69 |
from tkinter import * from matplotlib.figure import Figure from matplotlib.backends.backend_tkagg import FigureCanvasTkAgg, NavigationToolbar2Tk class Window(Tk): def __init__(self): super(Window, self).__init__() self.title("Legends & Navigation Toolbar") self.minsize(500,400) self.wm_iconbitmap("myicon.ico") self.create_matcanvas() def create_matcanvas(self): fig = Figure(figsize=(12,5), facecolor='white') axis = fig.add_subplot(111) xValues = [1,2,3,4] yValues0 = [6,7.5, 8, 7.5] yValues1 = [5.5, 6.5, 8,6] yValues2 = [6.5,7,8,7] t0, = axis.plot(xValues, yValues0) t1, = axis.plot(xValues, yValues1) t2, = axis.plot(xValues, yValues2) axis.set_ylabel("vertical Label") axis.set_xlabel("Horizontal Label") axis.grid() fig.legend((t0,t1,t2), ('First Line', 'Second Line', 'Third Line'), 'upper right') canvas = FigureCanvasTkAgg(fig, self) canvas.draw() canvas.get_tk_widget().pack(side = BOTTOM, fill = BOTH, expand =True) toolbar = NavigationToolbar2Tk(canvas, self) toolbar.update() canvas._tkcanvas.pack(side = TOP, fill = BOTH, expand =True) window = Window() window.mainloop() |
First we need to create a figure, also we are going to give the figure size.
|
1 |
fig = Figure(figsize=(12,5), facecolor='white') |
We have used subplot grid parameters encoded as a single integer. For example, “111” means “1×1 grid, first subplot” and “234” means “2×3 grid, 4th subplot”.
|
1 |
axis = fig.add_subplot(111) |
These are the values for plotting.
|
1 2 3 4 |
xValues = [1,2,3,4] yValues0 = [6,7.5, 8, 7.5] yValues1 = [5.5, 6.5, 8,6] yValues2 = [6.5,7,8,7] |
In here we have created the plotting axis.
|
1 2 3 |
t0, = axis.plot(xValues, yValues0) t1, = axis.plot(xValues, yValues1) t2, = axis.plot(xValues, yValues2) |
These are the x and y labels.
|
1 2 |
axis.set_ylabel("vertical Label") axis.set_xlabel("Horizontal Label") |
You can use this code for grid system in your graph.
|
1 |
axis.grid() |
This code is used for creating the legend.
|
1 2 |
fig.legend((t0,t1,t2), ('First Line', 'Second Line', 'Third Line'), 'upper right') |
Also this code is used for creating navigation toolbar.
|
1 2 |
toolbar = NavigationToolbar2Tk(canvas, self) toolbar.update() |
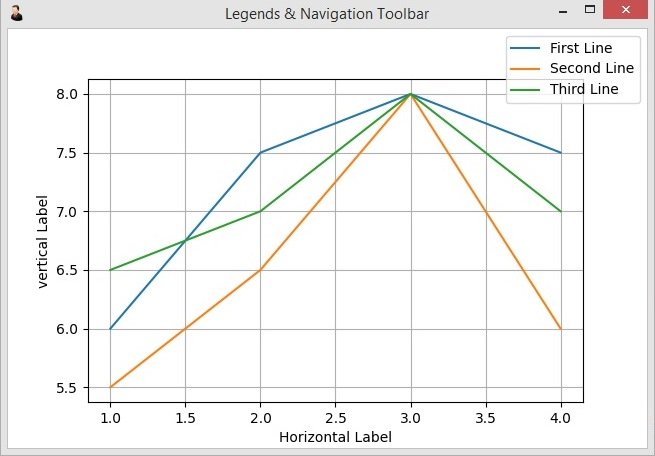
Run the complete code and this is the result.