In this wxPython article we want to learn about How to Integrate Yahoo Finance API with wxPython, for this purpose we want to use Yahoo Finance API or yfinance library, so Yahoo Finance API is popular choice for developers to obtain financial data. in this article we want to talk how to integrate Yahoo Finance API with wxPython using the yfinance library.
What is wxPython ?
wxPython is popular Python library for creating cross platform desktop applications. it is based on the popular C++ GUI toolkit wxWidgets. wxPython provides native look and feel on different platforms and has different widgets that can be used to create complex user interfaces.
What is yfinance ?
yfinance is Python library that allows you to download historical market data from Yahoo Finance API. it is popular library among finance enthusiasts and can be used to extract stock data for any stock listed on Yahoo Finance.
How to Integrate Yahoo Finance API with wxPython ?
First of all we need to install our required libraries for this article.
|
1 2 |
pip install wxpython pip install yfinance |
So first of all let’s create our basic GUI window using wxPython.
|
1 2 3 4 5 6 |
import wx app = wx.App() frame = wx.Frame(None, title='Geekscoders.com - Yahoo Finance API') frame.Show() app.MainLoop() |
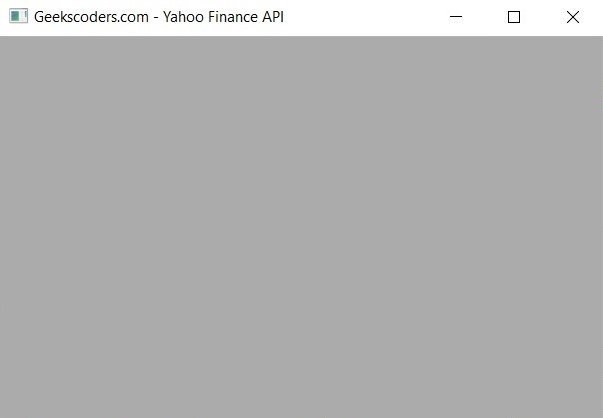
Run the code and this will be the result

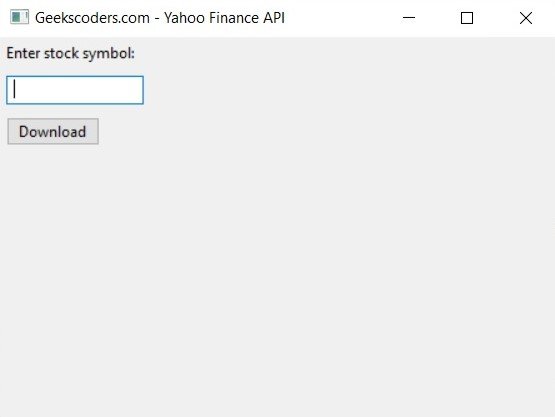
After that we need to create a GUI for our application. we want to create a simple GUI that consists of a text box and button. when the user enters the stock symbol in the text box and clicks the button, we will download the historical data for that stock from Yahoo Finance API.
|
1 2 3 4 5 6 7 8 9 10 11 12 13 14 15 16 17 18 19 20 21 22 23 24 25 |
import wx class MyFrame(wx.Frame): def __init__(self): wx.Frame.__init__(self, None, title='Geekscoders.com - Yahoo Finance API') panel = wx.Panel(self) self.stock_text = wx.TextCtrl(panel) self.download_button = wx.Button(panel, label='Download') sizer = wx.BoxSizer(wx.VERTICAL) sizer.Add(wx.StaticText(panel, label='Enter stock symbol:'), 0, wx.ALL, 5) sizer.Add(self.stock_text, 0, wx.ALL, 5) sizer.Add(self.download_button, 0, wx.ALL, 5) panel.SetSizer(sizer) self.Layout() app = wx.App() frame = MyFrame() frame.Show() app.MainLoop() |
Run the code and this will be the result

Now that we have created the GUI, we can download historical data from Yahoo Finance API. we will use the yfinance library to download the data.
|
1 2 3 4 5 6 7 8 9 10 11 12 13 14 15 16 17 18 19 20 21 22 23 24 25 26 27 28 29 30 31 32 33 34 35 36 37 38 39 40 41 42 43 44 45 46 |
import wx import yfinance as yf import pandas as pd import numpy as np import wx.grid class MyFrame(wx.Frame): def __init__(self): wx.Frame.__init__(self, None, title='Geekscoders.com - Yahoo Finance API') panel = wx.Panel(self) self.stock_text = wx.TextCtrl(panel) self.download_button = wx.Button(panel, label='Download') self.grid = wx.grid.Grid(panel) sizer = wx.BoxSizer(wx.VERTICAL) sizer.Add(wx.StaticText(panel, label='Enter stock symbol:'), 0, wx.ALL, 5) sizer.Add(self.stock_text, 0, wx.ALL, 5) sizer.Add(self.download_button, 0, wx.ALL, 5) sizer.Add(self.grid, 1, wx.EXPAND | wx.ALL, 5) panel.SetSizer(sizer) self.Layout() self.download_button.Bind(wx.EVT_BUTTON, self.download_data) def download_data(self, event): symbol = self.stock_text.GetValue() data = yf.download(symbol) self.grid.CreateGrid(data.shape[0], data.shape[1]) for i in range(data.shape[0]): for j in range(data.shape[1]): if isinstance(data.iloc[i, j], np.number): self.grid.SetCellValue(i, j, str(data.iloc[i, j])) else: self.grid.SetCellValue(i, j, data.iloc[i, j]) app = wx.App() frame = MyFrame() frame.Show() app.MainLoop() |
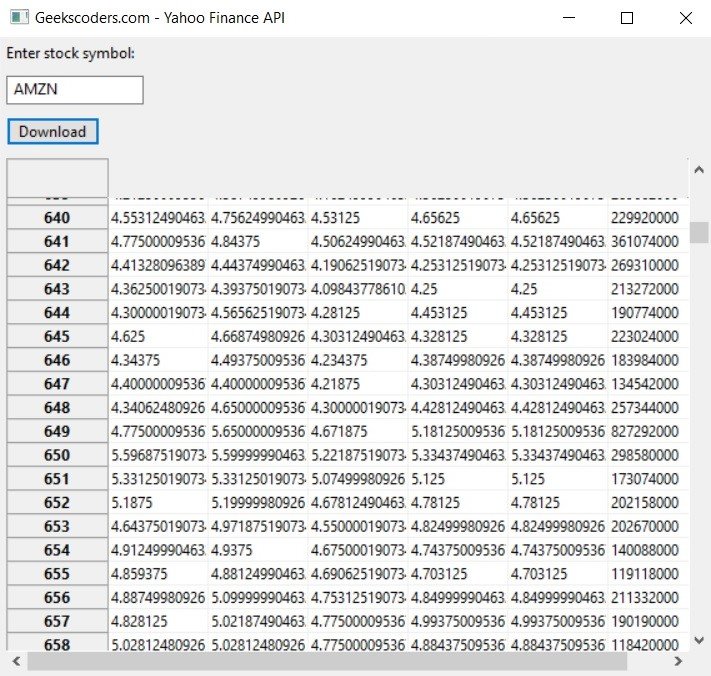
In the download_data method, we first get the stock symbol entered by the user from the text box. after that we use yf.download function to download the historical data for that stock from Yahoo Finance API. data is returned as pandas DataFrame. after that we creates a grid using wx.grid.Grid class and set its size based on the size of the downloaded data. we then loop through each cell in the grid and set its value to the corresponding value in the DataFrame. if the value in the DataFrame is a number, we convert it to a string before setting the cell value. this is necessary because SetCellValue method expects string as its argument. and lastly we show the grid in the GUI.
Run the code and this will be the result

