In this Python Kivy article we want to learn about How to Integrate Matplotlib with Python Kivy, Python Kivy is cross platform and open source framework used for developing mobile applications and desktop software. one of the major features of Kivy is its ability to provide different and inetractive user interfaces using different widgets. also it lacks the capability of generating data visualizations, which is where Matplotlib comes in. Matplotlib is powerful data visualization library used by data scientists, researchers and developers. integrating Matplotlib with Python Kivy allows developers to generate and display data visualizations within their Kivy application. in this article we want to explore how to integrate Matplotlib with Python Kivy.
How to Integrate Matplotlib with Python Kivy
First of all we need to install required libraries
|
1 2 |
pip install matplotlib pip install kivy |
Now that we have installed Matplotlib and Kivy, we can create Kivy application. in this code we want to create basic Kivy application with a button that generates simple plot.
|
1 2 3 4 5 6 7 8 9 |
from kivy.app import App from kivy.uix.button import Button class MyApp(App): def build(self): return Button(text='Generate Plot') if __name__ == '__main__': MyApp().run() |
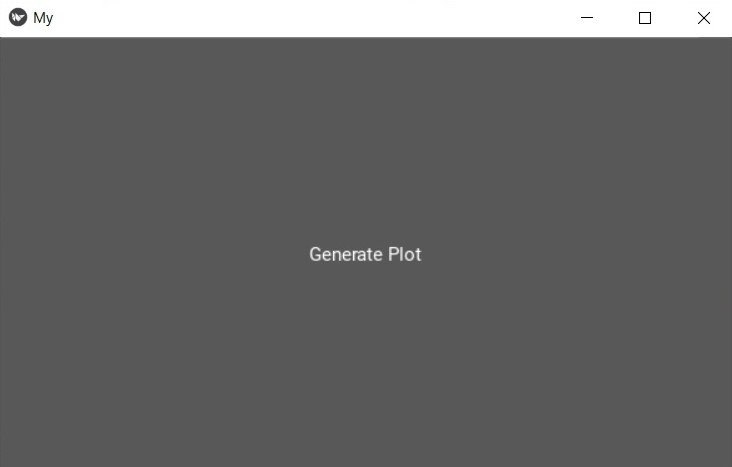
Above code creates basic Kivy application with single button that displays text Generate Plot next step is to integrate Matplotlib and generate a plot when the button is clicked.
This will be the result

In this step we want to integrate Matplotlib with Kivy , to generate a plot when the button is clicked. we want to use Matplotlib backend for Kivy, which allows us to create Matplotlib FigureCanvas that can be added to Kivy widget.
|
1 2 3 4 5 6 7 8 9 10 11 12 13 14 15 16 17 18 19 20 21 22 |
import matplotlib.pyplot as plt from kivy.app import App from kivy.uix.button import Button from kivy.uix.boxlayout import BoxLayout from kivy.garden.matplotlib import FigureCanvasKivyAgg class MyApp(App): def build(self): layout = BoxLayout(orientation='vertical') button = Button(text='Generate Plot') button.bind(on_press=self.generate_plot) layout.add_widget(button) return layout def generate_plot(self, instance): fig, ax = plt.subplots() ax.plot([1, 2, 3, 4]) canvas = FigureCanvasKivyAgg(fig) self.root.add_widget(canvas) if __name__ == '__main__': MyApp().run() |
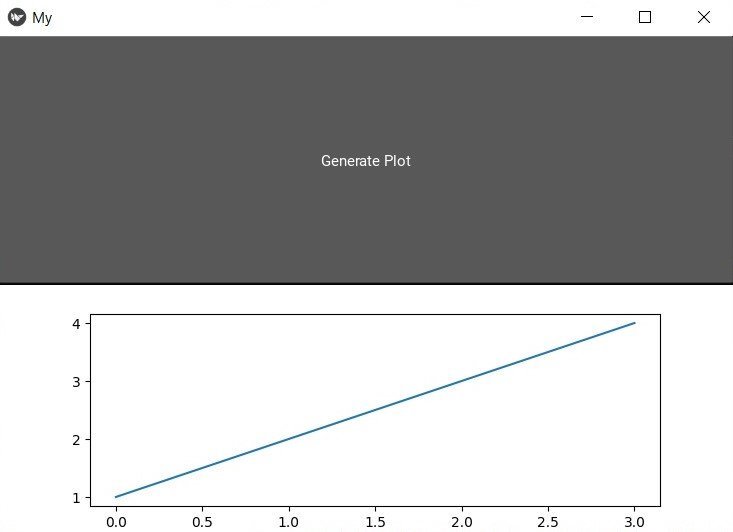
In the above code we have created new class that extends from Kivy App class. after that we have added BoxLayout widget to the app, which will hold the button and the generated plot. generate_plot() method is called when the button is clicked. this method creates simple plot using Matplotlib and creates FigureCanvasKivyAgg object that displays the plot in the Kivy app.
Run the code and this will be the result

