In this Python Lists article we want to talk about Python Lists for Data Analysis and Visualization, so as you know Python is powerful programming language for data analysis and visualization, and one of its most powerful data structures is list. Lists are used to store collection of items and can be manipulated in different ways to analyze and visualize data. in this article we want to explore the basics of Python lists for visualization.
For creating list in Python you can simply enclose sequence of values in square brackets, separated by commas. for example, this is list of numbers:
|
1 2 |
numbers = [1, 2, 3, 4, 5] print(numbers) |
If you run the code you will see this result

You can also create an empty list using empty square brackets:
|
1 |
my_list = [] |
Once you have a list you can access and manipulate its elements using indexing and slicing. for example for accessing the first element of numbers you can use this:
|
1 |
numbers[0] |
And to access the first three elements, you would use:
|
1 |
numbers[:3] |
You can also add and remove elements from a list using builtin list methods like append(), extend(), insert() and remove(). for example for adding new element to the end of numbers, you can use this:
|
1 |
numbers.append(6) |
And also for removing the second element you can use this:
|
1 |
del numbers[1] |
List Comprehensions
List comprehensions are the best way to create lists from other lists or iterable objects. they consist of an expression followed by for loop and can optionally include conditional statements. for example for creating a list of the squares of the numbers from 1 to 5, you can do like this:
|
1 2 |
squares = [x**2 for x in range(1, 6)] print(squares) |
This will be the result

And to create a list of only the even squares you can use this:
|
1 |
even_squares = [x**2 for x in range(1, 6) if x**2 % 2 == 0] |
Python Lists for Data Analysis and Visualization
After that you have your data stored in lists, you can use Python libraries like NumPy, Pandas and Matplotlib to perform different data analysis and visualization tasks.
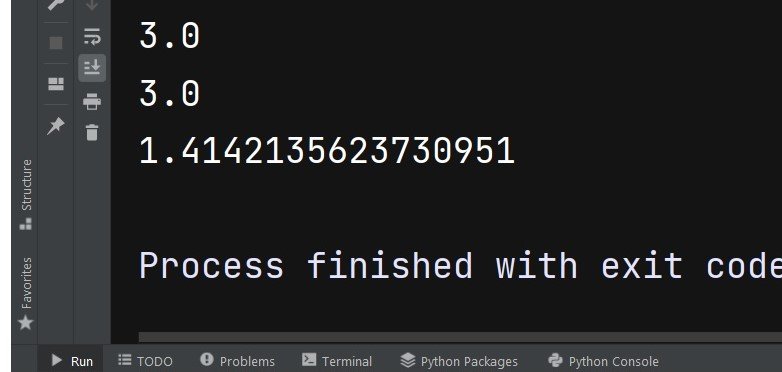
for example you can use NumPy to perform mathematical operations on lists such as finding the mean, median and standard deviation:
|
1 2 3 4 5 6 7 8 9 |
import numpy as np numbers = [1, 2, 3, 4, 5] mean = np.mean(numbers) median = np.median(numbers) std_dev = np.std(numbers) print(mean) print(median) print(std_dev) |
This is the result

And you can use Pandas to load and manipulate data from external sources like CSV files:
|
1 2 3 4 |
import pandas as pd df = pd.read_csv("data.csv") df.head() |
And at the end you can use Matplotlib to create different visualizations from your data such as line charts, scatter plots and histograms:
|
1 2 3 4 5 6 |
import matplotlib.pyplot as plt x = [1, 2, 3, 4, 5] y = [1, 4, 9, 16, 25] plt.plot(x, y) plt.show() |
Learn More on Python
- How to Optimize Python List Performance
- Difference Between Mutable and Immutable Lists in Python
- How to Create Multidimensional Lists in Python
- How to Implement Stacks and Queues with Python Lists
- How to Manipulate Python Lists with Slicing & Indexing
- Exploring Advanced Python List Operations and Tricks
