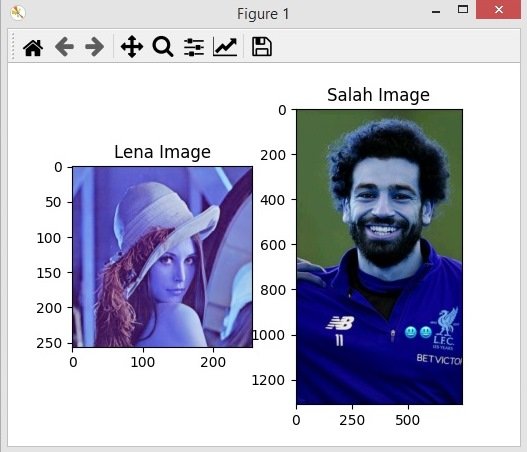
In this Python OpenCV lesson we are going to learn Python OpenCV Reading Multiple Image, some times you need to show two images, for example if you want to do image filtering, along side with original image you want to show the filtered image. for reading multiple images in OpenCV we are going to use Matplotlib, as we have already learned that how you can use Matplotlib for showing the image in opencv.
This is the complete code for this lesson.
|
1 2 3 4 5 6 7 8 9 10 11 12 13 14 15 16 17 |
import cv2 import matplotlib.pyplot as plt image = cv2.imread("lena.tif") image2 = cv2.imread("salah.jpg") #plotting the image plt.subplot(121) plt.imshow(image) plt.title("Lena Image") plt.subplot(122) plt.imshow(image2) plt.title("Salah Image") plt.show() |
You can see that in here we have used subplot() for showing of our two images, you need to give some arguments, the first one is the number of rows, after that the number of columns and at the end you need to give the image position, we want to do the same process for the second but just we are going to change the image from 1 to 2.
|
1 2 3 4 5 6 7 |
plt.subplot(121) plt.imshow(image) plt.title("Lena Image") plt.subplot(122) plt.imshow(image2) plt.title("Salah Image") |
If you run the code this will be the result.

We have our images, but you can see a color difference in our images, it is because opencv renders the image in order of GBR, the reverse of the usual RBG format. this is the reason the colors get messed up from OpenCV to matplotlib. The matplotlib module displays images according to the more conventional RGB method. Therefore, in order to correctly render images from OpenCV in matplotlib, what we need to do is to convert the GBR image into a RGB image.
We can use cv2.cvtColor() for converting our images.
|
1 2 |
cvt_image = cv2.cvtColor(image, cv2.COLOR_BGR2RGB) cvt_image2 = cv2.cvtColor(image2, cv2.COLOR_BGR2RGB) |
Now this is the complete code for converting the color.
|
1 2 3 4 5 6 7 8 9 10 11 12 13 14 15 16 17 18 19 20 |
import cv2 import matplotlib.pyplot as plt image = cv2.imread("lena.tif") image2 = cv2.imread("salah.jpg") #converting the image from bgr to rgb cvt_image = cv2.cvtColor(image, cv2.COLOR_BGR2RGB) cvt_image2 = cv2.cvtColor(image2, cv2.COLOR_BGR2RGB) #plotting the image plt.subplot(121) plt.imshow(cvt_image) plt.title("Lena Image") plt.subplot(122) plt.imshow(cvt_image2) plt.title("Salah Image") plt.show() |
If you run the code this will be the result and you can see that we have the correct color images.
