In this wxPython article we want to learn How to Integrate wxPython with Matplotlib, wxPython is popular GUI library for Python, and Matplotlib is powerful library for creating static, animated and interactive visualizations in Python. in this article we want to talk about how to integrate wxPython with Matplotlib to create interactive data visualizations in wxPython GUI application.
How to Integrate wxPython with Matplotlib
First of all we need to install required libraries for this article and we can use pip for that.
|
1 2 |
pip install wxPython pip install matplotlib |
For creating wxPython applications, we first need to import the wxPython module and create new wx.App instance. we also need to create new wx.Frame instance, which is top level window of our application, in this code we are creating new wx.Frame instance called MyFrame and setting its title and size. we are also creating new wx.App instance and starting the main event loop using the app.MainLoop() method.
|
1 2 3 4 5 6 7 8 9 10 11 12 |
import wx class MyFrame(wx.Frame): def __init__(self): super().__init__(None, title='Geekscoders.com', size=(800, 600)) app = wx.App() frame = MyFrame() frame.Show() app.MainLoop() |
Run the code and this will be the result

For adding Matplotlib canvas to our wxPython application, we first need to import the Matplotlib module and creates new Figure instance. after that we have created new Canvas instance using the FigureCanvasWxAgg class, which is Matplotlib canvas that can be embedded in wxPython application.
|
1 2 3 4 5 6 7 8 9 10 11 12 13 14 15 16 17 18 19 20 21 22 23 24 25 26 27 28 29 30 31 32 33 |
import wx import numpy as np from matplotlib.figure import Figure from matplotlib.backends.backend_wxagg import FigureCanvasWxAgg as Canvas class MyFrame(wx.Frame): def __init__(self): super().__init__(None, title='Geekscoders.com', size=(800, 600)) # Create new Matplotlib figure and canvas self.fig = Figure(figsize=(6, 4), dpi=100) self.canvas = Canvas(self, -1, self.fig) # Add Matplotlib canvas to the wxPython frame sizer = wx.BoxSizer(wx.VERTICAL) sizer.Add(self.canvas, 1, wx.EXPAND) self.SetSizer(sizer) # Plot sine wave on the Matplotlib canvas t = np.arange(0.0, 2.0, 0.01) s = np.sin(2 * np.pi * t) ax = self.fig.add_subplot(111) ax.plot(t, s) ax.set_xlabel('time (s)') ax.set_ylabel('voltage (mV)') ax.set_title('Sine Wave') app = wx.App() frame = MyFrame() frame.Show() app.MainLoop() |
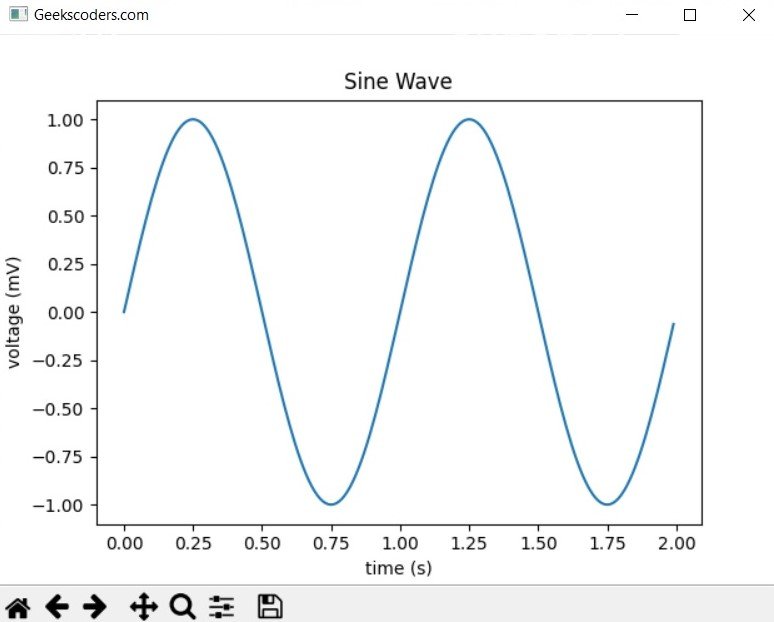
In the above code we are creating new numpy array t with values ranging from 0 to 2 seconds in steps of 0.01 seconds, and new numpy array s with the sine values of t. after that we are adding new subplot to the Matplotlib figure using the add_subplot() method and plotting the sine wave using the plot() method. and lastly we are setting the x and y labels and the title of the plot using the set_xlabel(), set_ylabel(), and set_title() methods.
Run the code and this will be the result
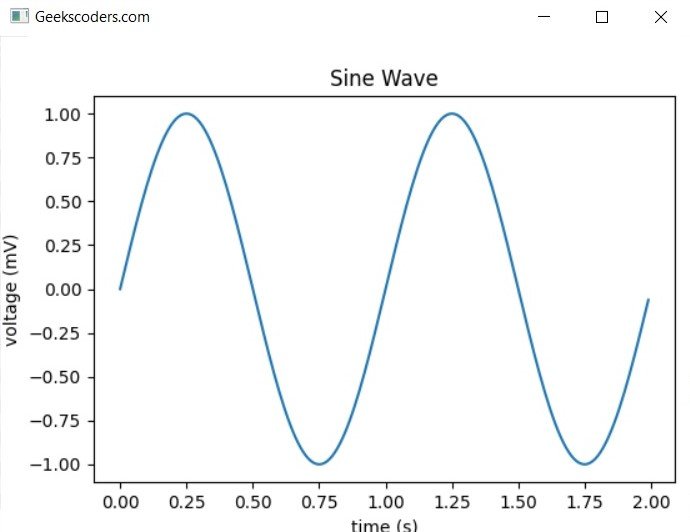
One of the benefits of using wxPython with Matplotlib is that we can easily add user interaction to our plots, such as zooming, panning and selecting data points. for adding user interaction to our Matplotlib canvas, we need to import the Matplotlib toolbar and add it to our wxPython frame like this.
|
1 2 3 4 5 6 7 8 9 10 11 12 13 14 15 16 17 18 19 20 21 22 23 24 25 26 27 28 29 30 31 32 33 34 35 36 37 38 |
import wx import numpy as np from matplotlib.figure import Figure from matplotlib.backends.backend_wxagg import FigureCanvasWxAgg as Canvas from matplotlib.backends.backend_wx import NavigationToolbar2Wx class MyFrame(wx.Frame): def __init__(self): super().__init__(None, title='Geekscoders.com', size=(800, 600)) # Create new Matplotlib figure and canvas self.fig = Figure(figsize=(6, 4), dpi=100) self.canvas = Canvas(self, -1, self.fig) # Add Matplotlib canvas to the wxPython frame sizer = wx.BoxSizer(wx.VERTICAL) sizer.Add(self.canvas, 1, wx.EXPAND) self.SetSizer(sizer) # Add Matplotlib toolbar to the wxPython frame toolbar = NavigationToolbar2Wx(self.canvas) sizer.Add(toolbar, 0, wx.LEFT | wx.EXPAND) # Plot sine wave on the Matplotlib canvas t = np.arange(0.0, 2.0, 0.01) s = np.sin(2 * np.pi * t) ax = self.fig.add_subplot(111) ax.plot(t, s) ax.set_xlabel('time (s)') ax.set_ylabel('voltage (mV)') ax.set_title('Sine Wave') app = wx.App() frame = MyFrame() frame.Show() app.MainLoop() |
In the above code we are importing Matplotlib toolbar class NavigationToolbar2Wx, which provides us with toolbar that we can use to interact with our plot. after that we are adding the toolbar to our wxPython frame using Add() method of the wx.BoxSizer object that we defined earlier.
Run the code and you will see the navigation bar at the bottom of the plot.