In this wxPython article we want to learn How to Integrate wxPython with other Python Libraries, so wxPython is powerful GUI library for Python that allows you to create desktop applications with native look and feel. also wxPython provides many builtin widgets and controls, but sometimes you may need to integrate it with other Python libraries to add additional functionality to your application.
Integrating wxPython with Matplotlib
Matplotlib is popular data visualization library for Python that allows you to create charts, graphs and plots. for using Matplotlib with wxPython, you can create FigureCanvasWxAgg object, which is a widget that embeds Matplotlib figure inside wxPython frame or panel.
|
1 2 3 4 5 6 7 8 9 10 11 12 13 14 15 16 17 18 19 20 21 22 23 24 25 26 27 |
import wx import matplotlib.pyplot as plt from matplotlib.backends.backend_wxagg import FigureCanvasWxAgg as FigureCanvas class MyFrame(wx.Frame): def __init__(self, parent, title): super(MyFrame, self).__init__(parent, title=title) # create a figure and axis fig, ax = plt.subplots() ax.plot([1, 2, 3, 4], [1, 4, 2, 3]) # create a canvas and add the figure to it canvas = FigureCanvas(self, -1, fig) # add the canvas to the frame sizer = wx.BoxSizer(wx.VERTICAL) sizer.Add(canvas, 1, wx.EXPAND) self.SetSizer(sizer) self.Fit() app = wx.App() frame = MyFrame(None, "Geekscoders - Matplotlib with wxPython") frame.Show() app.MainLoop() |
In this example, we have created MyFrame class that extends from wx.Frame. in the __init__ method, we creates Matplotlib figure and axis, and after that creates FigureCanvasWxAgg widget that displays the figure. and at the end we add the canvas to the frame using a sizer.
Run the code and this will be the result

Integrating wxPython with Pandas
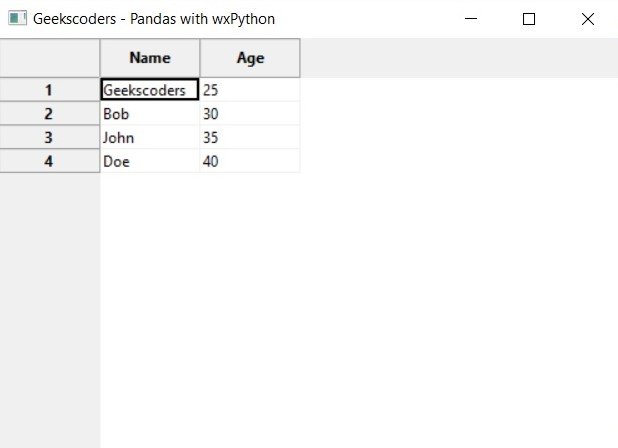
Pandas is powerful data analysis library for Python that allows you to manipulate and analyze data in different formats including CSV, Excel SQL databases and many more. For using Pandas with wxPython, you can create wx.grid.Grid object which is a widget that displays tabular data.
|
1 2 3 4 5 6 7 8 9 10 11 12 13 14 15 16 17 18 19 20 21 22 23 24 25 26 27 28 29 30 31 32 |
import wx import pandas as pd import wx.grid class MyFrame(wx.Frame): def __init__(self, parent, title): super(MyFrame, self).__init__(parent, title=title) # create pandas dataframe data = {'Name': ['Geekscoders', 'Bob', 'John', 'Doe'], 'Age': [25, 30, 35, 40]} df = pd.DataFrame(data) # create wx.grid.Grid widget and set the data grid = wx.grid.Grid(self, -1) grid.CreateGrid(len(df.index), len(df.columns)) for i, col in enumerate(df.columns): grid.SetColLabelValue(i, col) for i, row in df.iterrows(): for j, val in enumerate(row): grid.SetCellValue(i, j, str(val)) # add the grid to the frame sizer = wx.BoxSizer(wx.VERTICAL) sizer.Add(grid, 1, wx.EXPAND) self.SetSizer(sizer) self.Fit() app = wx.App() frame = MyFrame(None, "Geekscoders - Pandas with wxPython") frame.Show() app.MainLoop() |
Run the code and this will be the result

