In this Python PyQt5 Tutorial we are going to start working with Python PyQt5 Charts, we want to draw different charts like barchart, pie chart, line chart and donut chart in Python PyQt5, for creating charts in Python PyQt5 we need to use PyQtChart library in pyqt5, so PyQtChart is a set of Python bindings for The Qt Company’s Qt Charts library. The bindings sit on top of PyQt5 and are implemented as a single module.
First of all you need to install pyqtchart, you can use pip for the installation.
|
1 |
pip install PyQtChart |
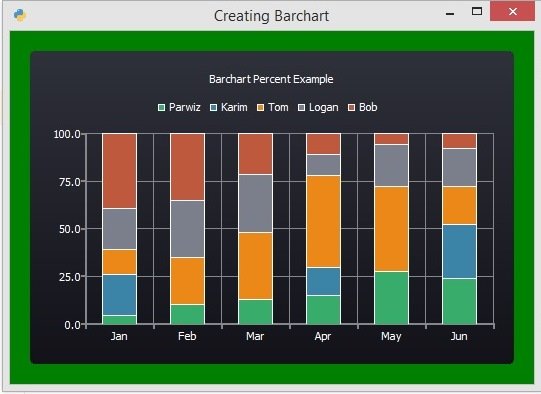
1: Creating BarChart in PyQt5
Now we want to create barchart in pyqt5, this is the complete source code.
|
1 2 3 4 5 6 7 8 9 10 11 12 13 14 15 16 17 18 19 20 21 22 23 24 25 26 27 28 29 30 31 32 33 34 35 36 37 38 39 40 41 42 43 44 45 46 47 48 49 50 51 52 53 54 55 56 57 58 59 60 61 62 63 64 65 66 67 68 69 70 71 72 73 74 75 76 77 78 79 80 |
from PyQt5.QtWidgets import QApplication, QWidget, QVBoxLayout from PyQt5.QtChart import QChart, QChartView, QBarSet, \ QPercentBarSeries, QBarCategoryAxis import sys from PyQt5.QtGui import QIcon class Window(QWidget): def __init__(self): super().__init__() #window requirements self.setGeometry(200,200,600,400) self.setWindowTitle("Creating Barchart") self.setWindowIcon(QIcon("python.png")) #change the color of the window self.setStyleSheet('background-color:green') #create barseries set0 = QBarSet("Parwiz") set1 = QBarSet("Karim") set2 = QBarSet("Tom") set3 = QBarSet("Logan") set4 = QBarSet("Bob") #insert data to the barseries set0 << 1 << 2 << 3 << 4 << 5 << 6 set1 << 5 << 0 << 0 << 4 << 0 << 7 set2 << 3 << 5 << 8 << 13 << 8 << 5 set3 << 5 << 6 << 7 << 3 << 4 << 5 set4 << 9 << 7 << 5 << 3 << 1 << 2 #we want to create percent bar series series = QPercentBarSeries() series.append(set0) series.append(set1) series.append(set2) series.append(set3) series.append(set4) #create chart and add the series in the chart chart = QChart() chart.addSeries(series) chart.setTitle("Barchart Percent Example") chart.setAnimationOptions(QChart.SeriesAnimations) chart.setTheme(QChart.ChartThemeDark) #create axis for the chart categories = ["Jan", "Feb", "Mar", "Apr", "May", "Jun"] axis = QBarCategoryAxis() axis.append(categories) chart.createDefaultAxes() chart.setAxisX(axis, series) #create chartview and add the chart in the chartview chartview = QChartView(chart) vbox = QVBoxLayout() vbox.addWidget(chartview) self.setLayout(vbox) App = QApplication(sys.argv) window = Window() window.show() sys.exit(App.exec()) |
In the above code first you need to create some barsets, you can use QBarSet class for this.
|
1 |
set0 = QBarSet("Parwiz") |
After that you need to insert some data to the barset.
|
1 |
set0 << 1 << 2 << 3 << 4 << 5 << 6 |
Because we want to create percent barset, so for this you need to create QPercentBarSeries.
|
1 |
series = QPercentBarSeries() |
For drawing of every kind charts, you need to create the object of QChart and QChartView, first we want to create our QChart. also we have added some features like title and animation to the chart.
|
1 2 3 4 5 |
chart = QChart() chart.addSeries(series) chart.setTitle("Barchart Percent Example") chart.setAnimationOptions(QChart.SeriesAnimations) chart.setTheme(QChart.ChartThemeDark) |
Also we need to create axis for the chart.
|
1 2 3 4 5 6 |
categories = ["Jan", "Feb", "Mar", "Apr", "May", "Jun"] axis = QBarCategoryAxis() axis.append(categories) chart.createDefaultAxes() chart.setAxisX(axis, series) |
Now you need to create QChartView and add the chart in the chartview.
|
1 |
chartview = QChartView(chart) |
At the end you need to create QVBoxLayout and add the chartview in the vertical box layout.
|
1 2 |
vbox = QVBoxLayout() vbox.addWidget(chartview) |
Run the complete code and this is the result.
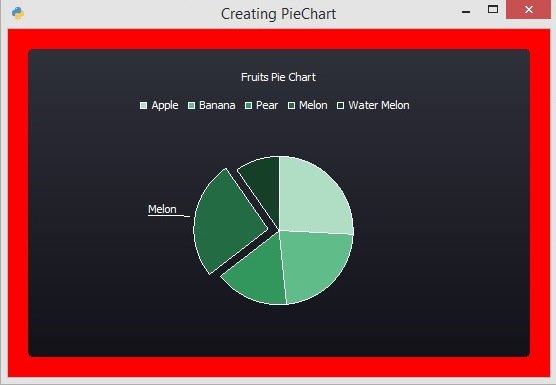
2: Creating PieChart in PyQt5
Let’s create piechart, this is the complete code for creating piechart.
|
1 2 3 4 5 6 7 8 9 10 11 12 13 14 15 16 17 18 19 20 21 22 23 24 25 26 27 28 29 30 31 32 33 34 35 36 37 38 39 40 41 42 43 44 45 46 47 48 49 50 51 52 53 54 55 56 57 58 59 60 61 |
from PyQt5.QtWidgets import QApplication, QWidget, QVBoxLayout import sys from PyQt5.QtGui import QIcon, QPen from PyQt5.QtChart import QChart, QChartView, QPieSeries from PyQt5.QtCore import Qt class Window(QWidget): def __init__(self): super().__init__() # window requirements self.setGeometry(200,200,600,400) self.setWindowTitle("Creating PieChart") self.setWindowIcon(QIcon("python.png")) # change the color of the window self.setStyleSheet('background-color:red') #create pieseries series = QPieSeries() #append some data to the series series.append("Apple", 80) series.append("Banana", 70) series.append("Pear", 50) series.append("Melon", 80) series.append("Water Melon", 30) #slice my_slice = series.slices()[3] my_slice.setExploded(True) my_slice.setLabelVisible(True) my_slice.setPen(QPen(Qt.green, 4)) my_slice.setBrush(Qt.green) #create QChart object chart = QChart() chart.addSeries(series) chart.setAnimationOptions(QChart.SeriesAnimations) chart.setTitle("Fruits Pie Chart") chart.setTheme(QChart.ChartThemeDark) # create QChartView object and add chart in thier chartview = QChartView(chart) vbox = QVBoxLayout() vbox.addWidget(chartview) self.setLayout(vbox) App = QApplication(sys.argv) window = Window() window.show() sys.exit(App.exec()) |
You can use QPieSeries for creating the piechart in pyqt5.
|
1 |
series = QPieSeries() |
These are some data that we have added to the series.
|
1 2 3 4 5 |
series.append("Apple", 80) series.append("Banana", 70) series.append("Pear", 50) series.append("Melon", 80) series.append("Water Melon", 30) |
If you want to add slice to piechart than you can use this code.
|
1 2 3 4 5 |
my_slice = series.slices()[3] my_slice.setExploded(True) my_slice.setLabelVisible(True) my_slice.setPen(QPen(Qt.green, 4)) my_slice.setBrush(Qt.green) |
Also you need to create QChart and QChartView and add the chartview in the VBoxLayout.
Run the complete code and this is the result.
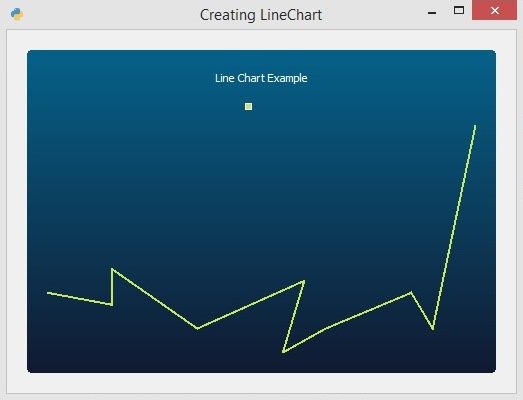
3: Creating LineChart in PyQt5
Now we want to create linechart in pyqt5, so linecharts are typically presented as a series of points/markers that are connected by lines. In a line chart, the points are connected by straight lines to show the changes of the variables over a period of time. this is the complete code.
|
1 2 3 4 5 6 7 8 9 10 11 12 13 14 15 16 17 18 19 20 21 22 23 24 25 26 27 28 29 30 31 32 33 34 35 36 37 38 39 40 41 42 43 44 45 46 |
from PyQt5.QtWidgets import QApplication, QWidget, QVBoxLayout import sys from PyQt5.QtGui import QIcon from PyQt5.QtChart import QChart, QChartView, QLineSeries from PyQt5.QtCore import QPointF class Window(QWidget): def __init__(self): super().__init__() self.setGeometry(200,200,600,400) self.setWindowTitle("Creating LineChart") self.setWindowIcon(QIcon("python.png")) series = QLineSeries() series.append(0,6) series.append(3,5) series.append(3,8) series.append(7,3) series.append(12,7) series << QPointF(11,1) << QPointF(13,3)\ << QPointF(17,6) << QPointF(18,3) << QPointF(20,20) chart = QChart() chart.addSeries(series) chart.setAnimationOptions(QChart.SeriesAnimations) chart.setTitle("Line Chart Example") chart.setTheme(QChart.ChartThemeBlueCerulean) chartview = QChartView(chart) vbox = QVBoxLayout() vbox.addWidget(chartview) self.setLayout(vbox) App = QApplication(sys.argv) window = Window() window.show() sys.exit(App.exec()) |
These are the data for our QLineSeries , also we have created the object of QLineSeries in here.
|
1 2 3 4 5 6 7 8 9 |
series = QLineSeries() series.append(0,6) series.append(3,5) series.append(3,8) series.append(7,3) series.append(12,7) series << QPointF(11,1) << QPointF(13,3) << QPointF(17,6) << QPointF(18,3) << QPointF(20,20) |
OK now i have said that when you want to create some kind of charts in PyQtChart, creating of QChart and QChartView are important for every kind of charts. and now first we create our QChart object and we add our series to QChart object and we set a title with animation for our QChart.
|
1 2 3 4 5 |
chart = QChart() chart.addSeries(series) chart.setAnimationOptions(QChart.SeriesAnimations) chart.setTitle("Line Chart Example") chart.setTheme(QChart.ChartThemeBlueCerulean) |
And at the end we create our QChartView and we add our QChart object in our ChartView.
|
1 |
chartview = QChartView(chart) |
Run the complete code and this is the result.
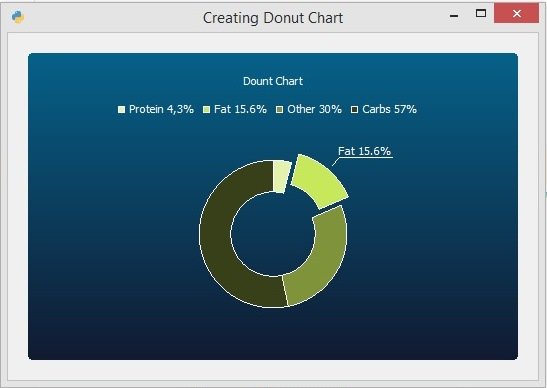
4: Creating DonutChart in PyQt5
Let’s create DonutChart in PyQt5, a donut chart is a Pie Chart with an area of the center cut out. Pie Charts are sometimes criticized for focusing readers on the proportional areas of the slices to one another and to the chart as a whole. This makes it tricky to see the differences between slices, especially when you try to compare multiple Pie Charts together. A Donut Chart somewhat remedies this problem by de-emphasizing the use of the area. Instead, readers focus more on reading the length of the arcs, rather than comparing. so this is the complete code for creating donutchart.
|
1 2 3 4 5 6 7 8 9 10 11 12 13 14 15 16 17 18 19 20 21 22 23 24 25 26 27 28 29 30 31 32 33 34 35 36 37 38 39 40 41 42 43 44 45 46 47 |
from PyQt5.QtWidgets import QApplication, QWidget, QVBoxLayout import sys from PyQt5.QtGui import QIcon from PyQt5.QtChart import QChart, QChartView, QPieSeries class Window(QWidget): def __init__(self): super().__init__() self.setGeometry(200,200,600,400) self.setWindowTitle("Creating Donut Chart") self.setWindowIcon(QIcon("python.png")) series = QPieSeries() series.setHoleSize(0.40) series.append("Protein 4,3%", 4.3) my_slice = series.append("Fat 15.6%", 15.6) my_slice.setExploded(True) my_slice.setLabelVisible(True) series.append("Other 30%", 30) series.append("Carbs 57%", 57) chart = QChart() chart.addSeries(series) chart.setAnimationOptions(QChart.SeriesAnimations) chart.setTitle("Dount Chart") chart.setTheme(QChart.ChartThemeBlueCerulean) chartview = QChartView(chart) vbox = QVBoxLayout() vbox.addWidget(chartview) self.setLayout(vbox) App = QApplication(sys.argv) window = Window() window.show() sys.exit(App.exec()) |
This is the code for creating donutchart. in this code first of all we have created the object for QPieSeries, in the introduction of donutchart we have said, that it is a type of PieChart. and we are adding some data to the QPieSeries with some functionality of DonutChart.
|
1 2 3 4 5 6 7 8 9 10 11 |
series = QPieSeries() series.setHoleSize(0.40) series.append("Protein 4,3%", 4.3) my_slice = series.append("Fat 15.6%", 15.6) my_slice.setExploded(True) my_slice.setLabelVisible(True) series.append("Other 30%", 30) series.append("Carbs 57%", 57) |
Run the complete code and this is the result.