
In this Python Kivy lesson i want to show you How to Create BarChart with Python Kivy, so Bar charts are popular way of representing data in graphical form. with Kivy framework in Python you can create bar charts that are both visually appealing and interactive.
How to Create BarChart with Python Kivy
First of all we need to install our required libraries and modules for this article
|
1 |
pip install kivy |
|
1 |
garden install graph |
So after installation, now we need to import our required modules from Python Kivy.
|
1 2 |
from kivy.app import App from kivy.garden.graph import Graph, MeshLinePlot |
For creating bar chart, we need to create a Graph object and add MeshLinePlot to it. MeshLinePlot is used to plot the data on the graph. this is an example of how to create a bar chart:
|
1 2 3 4 5 6 7 8 9 10 11 12 13 14 15 16 17 18 19 20 |
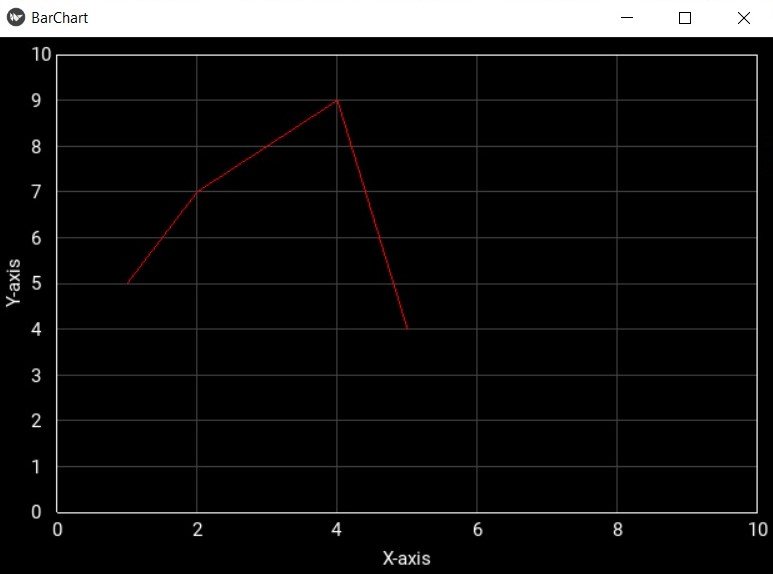
graph = Graph( xlabel='X-axis', ylabel='Y-axis', x_ticks_major=2, y_ticks_major=1, y_grid_label=True, x_grid_label=True, padding=5, x_grid=True, y_grid=True, xmin=0, xmax=10, ymin=0, ymax=10 ) plot = MeshLinePlot(color=[1, 0, 0, 1]) plot.points = [(1, 5), (2, 7), (3, 8), (4, 9), (5, 4)] graph.add_plot(plot) |
In the above example we have created a Graph object with different properties such as x and y axis labels, x and y major ticks, padding and many more. after that we have created MeshLinePlot object with red color and plotted the data using points attribute. and lastly we add MeshLinePlot to the Graph object.
Once we have created bar chart, we need to create the app.
|
1 2 3 4 5 6 |
class BarChartApp(App): def build(self): return graph if __name__ == '__main__': BarChartApp().run() |
In the above example we have created BarChartApp class that extends from App. after that we have define build method to return the Graph object we created earlier. and finally we creates an instance of BarChartApp and run it.
This is the complete code for this article
|
1 2 3 4 5 6 7 8 9 10 11 12 13 14 15 16 17 18 19 20 21 22 23 24 25 26 27 28 29 30 |
from kivy.app import App from kivy.garden.graph import Graph, MeshLinePlot graph = Graph( xlabel='X-axis', ylabel='Y-axis', x_ticks_major=2, y_ticks_major=1, y_grid_label=True, x_grid_label=True, padding=5, x_grid=True, y_grid=True, xmin=0, xmax=10, ymin=0, ymax=10 ) plot = MeshLinePlot(color=[1, 0, 0, 1]) plot.points = [(1, 5), (2, 7), (3, 8), (4, 9), (5, 4)] graph.add_plot(plot) class BarChartApp(App): def build(self): return graph if __name__ == '__main__': BarChartApp().run() |
Run the code and this will be the result
Learn More on Kivy
- Introduction to Python Kivy
- How to Integrate Yahoo Finance with Python Kivy
- How to Build Music Player with Kivy
- Build Android Application with Python Kivy
- How to Integrate Matplotlib with Python Kivy
- How to Integrate Pandas with Python Kivy
- Building Cross Platform GUI Applications with Python Kivy
- Getting Started with Kivy in Python
- How to Create Uis with Python and Kivy