
In this Python Kivy article we want to learn How to Create LineChart with Python Kivy, Python Kivy is powerful framework for developing user interfaces in Python. it is open source and can be used to develop applications for desktops, mobile devices and web. in this article we want to learn how to create a LineChart with Kivy Python.
How to Create LineChart with Python Kivy
First of all we need to install required modules
|
1 |
pip install kivy matplotlib |
after that we have installed required libraries, we need to import them in our Python code. we want to use Kivy for creating user interface and Matplotlib for creating the LineChart.
|
1 2 3 4 5 |
import kivy from kivy.app import App from kivy.uix.boxlayout import BoxLayout from kivy.garden.matplotlib.backend_kivyagg import FigureCanvasKivyAgg import matplotlib.pyplot as plt |
Next we need to create user interface using Kivy. we want to create BoxLayout and add a Matplotlib FigureCanvasKivyAgg widget to it.
|
1 2 3 4 5 6 7 8 9 10 11 12 13 |
class LineChartApp(App): def build(self): # Create BoxLayout box_layout = BoxLayout(orientation='vertical') # Create Matplotlib FigureCanvasKivyAgg widget figure, ax = plt.subplots() canvas = FigureCanvasKivyAgg(figure) # Add Matplotlib widget to the BoxLayout box_layout.add_widget(canvas) return box_layout |
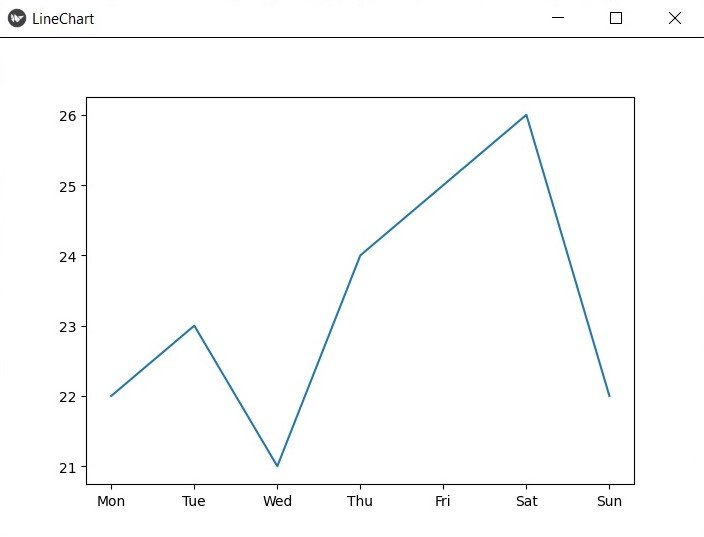
And finally we need to create LineChart using Matplotlib. we will use simple example to create a LineChart that shows daily temperature for a week.
|
1 2 3 4 5 6 7 8 9 10 11 12 13 14 15 16 17 18 |
class LineChartApp(App): def build(self): # Creat BoxLayout box_layout = BoxLayout(orientation='vertical') # Create Matplotlib FigureCanvasKivyAgg widget figure, ax = plt.subplots() canvas = FigureCanvasKivyAgg(figure) # Add Matplotlib widget to the BoxLayout box_layout.add_widget(canvas) # Create LineChart days = ['Mon', 'Tue', 'Wed', 'Thu', 'Fri', 'Sat', 'Sun'] temperatures = [22, 23, 21, 24, 25, 26, 22] ax.plot(days, temperatures) return box_layout |
Now we can run our application by creating an instance of LineChartApp class and calling its run method.
|
1 2 |
if __name__ == '__main__': LineChartApp().run() |
This is the complete code for this article
|
1 2 3 4 5 6 7 8 9 10 11 12 13 14 15 16 17 18 19 20 21 22 23 24 25 26 27 |
import kivy from kivy.app import App from kivy.uix.boxlayout import BoxLayout from kivy.garden.matplotlib.backend_kivyagg import FigureCanvasKivyAgg import matplotlib.pyplot as plt class LineChartApp(App): def build(self): # Creat BoxLayout box_layout = BoxLayout(orientation='vertical') # Create Matplotlib FigureCanvasKivyAgg widget figure, ax = plt.subplots() canvas = FigureCanvasKivyAgg(figure) # Add Matplotlib widget to the BoxLayout box_layout.add_widget(canvas) # Create LineChart days = ['Mon', 'Tue', 'Wed', 'Thu', 'Fri', 'Sat', 'Sun'] temperatures = [22, 23, 21, 24, 25, 26, 22] ax.plot(days, temperatures) return box_layout if __name__ == '__main__': LineChartApp().run() |
When you run this code, it will creates a LineChart that displays daily temperature for a week. you can modify data and labels to create your own LineChart with Kivy.
Run the code and this will be the result
Learn More on Kivy
- Introduction to Python Kivy
- How to Integrate Yahoo Finance with Python Kivy
- How to Build Music Player with Kivy
- Build Android Application with Python Kivy
- How to Integrate Matplotlib with Python Kivy
- How to Integrate Pandas with Python Kivy
- Building Cross Platform GUI Applications with Python Kivy
- Getting Started with Kivy in Python
- How to Create Uis with Python and Kivy
- How to Create BarChart with Python Kivy
