
In this article we want to learn about How to Find Amazon Stock Price with Python, are you interested in tracking stock price of Amazon, one of the world largest ecommerce and cloud computing companies ? Do you want to automate this process using Python, powerful and popular programming language for data analysis and visualization ? If so you are in the right place. in this tutorial we want to learn how to use Python and the yfinance library to fetch and display the current and historical stock price data of Amazon, and how to visualize this data using popular libraries such as Matplotlib and Pandas. No prior knowledge of Python or finance is required, but some familiarity with programming concepts and tools will be helpful.
How to Find Amazon Stock Price with Python
First of all we need to install required libraries
|
1 2 3 |
pip install yfinance pip install matplotlib pip install pandas |
So now let’s fetch the data, we want to use yfinance library to fetch Amazon stock price data. yfinance is Python library that allows us to download financial data from Yahoo Finance.
|
1 2 3 4 5 6 7 8 9 10 11 12 13 14 15 |
import yfinance as yf # Get Amazon stock data amzn = yf.Ticker("AMZN") data = amzn.history(period="max") # Calculate moving average for 30 day and 100 day periods data['MA30'] = data['Close'].rolling(window=30).mean() data['MA100'] = data['Close'].rolling(window=100).mean() # Calculate daily returns data['Daily_Return'] = data['Close'].pct_change() # Print summary statistics print(data.describe()) |
So this code imports yfinance library and after that fetches the stock data for Amazon (AMZN) using yf.Ticker() method. data is stored in a pandas DataFrame named data. after that we calculates two moving averages, one for 30 day period and another for 100 day period, using the rolling() method. moving averages are stored in new columns in the data DataFrame named MA30 and MA100.
this code also calculates daily returns by using pct_change() method on the Close column of the data DataFrame. daily returns are stored in new column named Daily_Return.
and lastly we prints the summary statistics for the data DataFrame using the describe() method. summary statistics includes count, mean, standard deviation, minimum, maximum, and quartile values for each column in the DataFrame.
This will be the result

So in the previous example we have just printed the data, now we want to visualize the data and for that we will use the matplotlib library to visualize the fetched data. matplotlib is plotting library for the Python programming language and its numerical mathematics extension NumPy.
|
1 2 3 4 5 6 7 8 9 10 11 12 13 14 15 16 17 18 19 20 21 22 23 24 25 |
import yfinance as yf import matplotlib.pyplot as plt # Get Amazon stock data amzn = yf.Ticker("AMZN") data = amzn.history(period="max") # Calculate moving average for 30 day and 100 day periods data['MA30'] = data['Close'].rolling(window=30).mean() data['MA100'] = data['Close'].rolling(window=100).mean() # Calculate daily returns data['Daily_Return'] = data['Close'].pct_change() # Plot closing price and moving averages plt.plot(data['Close']) plt.plot(data['MA30']) plt.plot(data['MA100']) plt.legend(['Close', 'MA30', 'MA100']) plt.show() # Plot daily returns plt.plot(data['Daily_Return']) plt.show() |
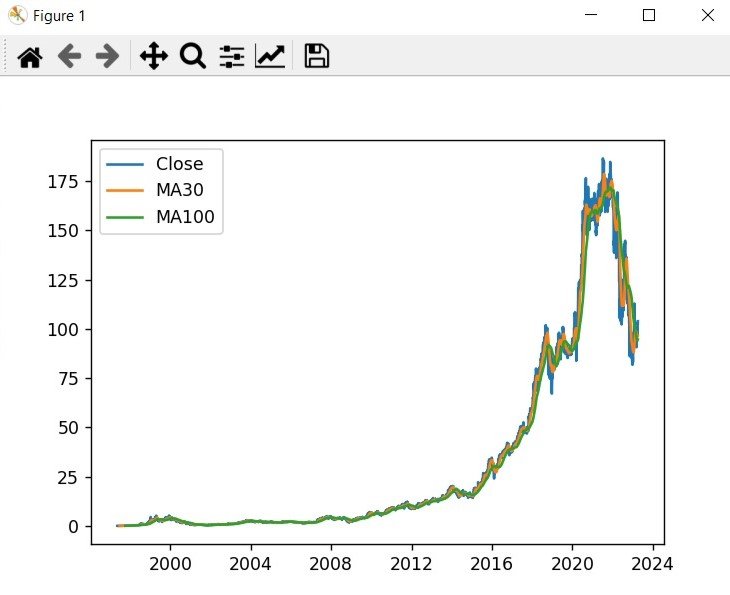
Run the code and this will be the result

Learn More on Python
- Qt Designer Tool in PyQt6
- How to Use Stylesheets in Python PyQt6
- Event Handling in Python and PyQt6
- Responsive Applications with PyQt6 Multithreading
- How to Deploy PyQt6 Applications
- How to Build Web Applications with PyQt6
- How to Create ComboBox in PySide6
- How to Create CheckBox in Python PySide6
- Responsive Applications with PyQt6 Multithreading
- Event Handling in Python and PyQt6
- How to Use Stylesheets in Python PyQt6
