In this Python article we want to learn about How to Use Python for Analyzing Financial Data, Python is popular language for financial analysis and visualization due to its simplicity and power. In this article we want to learn how Python can be used to analyze and visualize financial data.
How to Use Python for Analyzing Financial Data
The first step in analyzing financial data is to gather and clean the data. Financial data can be found in different sources such as Bloomberg, Yahoo Finance and other financial websites. After the data has been gathered it is important to clean it by removing any missing or inaccurate data points.
Python has different libraries that can be used to clean and prepare financial data. some popular libraries include Pandas, NumPy and Matplotlib.
Once the data has been cleaned it is time to analyze it. Python provides different tools for financial analysis. one of the most popular libraries for financial analysis is Pandas. Pandas provides data structures and functions for efficiently working with large datasets.
some common financial analysis tasks that can be performed using Pandas include calculating returns, calculating moving averages and computing correlations between assets. Python also provides libraries such as NumPy which can be used for more complex financial calculations such as option pricing.
Visualizing financial data is an important step in understanding the data and communicating the results. Python provides several libraries that can be used to create high quality visualizations of financial data. Matplotlib is popular library for creating static plots while Plotly is popular library for creating interactive plots.
some common financial visualizations that can be created using Python include line charts, bar charts and scatter plots. these visualizations can be used to explore trends in the data, compare different assets, and visualize portfolio performance.
Now let’s create practical example, and we want to create practical example of using Python for finance. we want to use Pandas library to analyze and visualize the performance of two stocks Apple (AAPL) and Microsoft (MSFT) over one year period.
First we need to import required libraries
|
1 2 3 4 |
import pandas as pd import numpy as np import matplotlib.pyplot as plt import yfinance as yf |
Make sure that you have install yfinance, you can use pip for that
|
1 |
pip install yfinance |
After that we are going to download the historical stock data for AAPL and MSFT using yfinance
|
1 2 3 4 5 |
start_date = '2022-03-01' end_date = '2023-03-27' aapl = yf.download('AAPL', start=start_date, end=end_date) msft = yf.download('MSFT', start=start_date, end=end_date) |
Now that we have the data, we can begin analyzing it. let’s start by calculating the daily returns for each stock
|
1 2 |
aapl_returns = aapl['Adj Close'].pct_change() msft_returns = msft['Adj Close'].pct_change() |
After that we calculate the mean and standard deviation of the daily returns for each stock
|
1 2 3 4 5 |
aapl_mean_return = np.mean(aapl_returns) msft_mean_return = np.mean(msft_returns) aapl_std_dev = np.std(aapl_returns) msft_std_dev = np.std(msft_returns) |
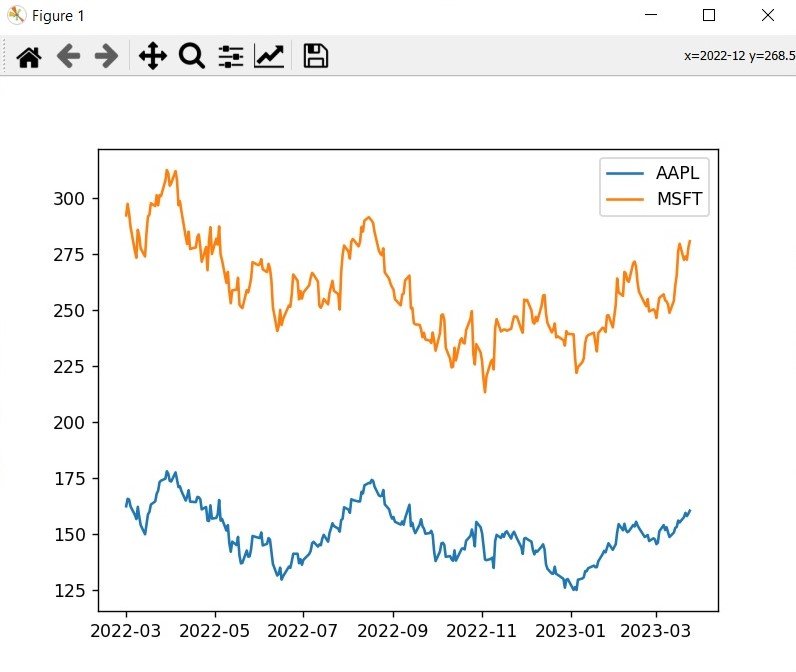
And finally we visualize the performance of each stock using line chart
|
1 2 3 4 |
plt.plot(aapl.index, aapl['Adj Close'], label='AAPL') plt.plot(msft.index, msft['Adj Close'], label='MSFT') plt.legend() plt.show() |
So this is the complete code for this article
|
1 2 3 4 5 6 7 8 9 10 11 12 13 14 15 16 17 18 19 20 21 22 23 24 25 26 27 28 |
import pandas as pd import numpy as np import matplotlib.pyplot as plt import yfinance as yf # Download historical data for AAPL and MSFT start_date = '2022-03-01' end_date = '2023-03-27' aapl = yf.download('AAPL', start=start_date, end=end_date) msft = yf.download('MSFT', start=start_date, end=end_date) # Calculate daily returns aapl_returns = aapl['Adj Close'].pct_change() msft_returns = msft['Adj Close'].pct_change() # Calculate mean and standard deviation of daily returns aapl_mean_return = np.mean(aapl_returns) msft_mean_return = np.mean(msft_returns) aapl_std_dev = np.std(aapl_returns) msft_std_dev = np.std(msft_returns) # Plot stock performance plt.plot(aapl.index, aapl['Adj Close'], label='AAPL') plt.plot(msft.index, msft['Adj Close'], label='MSFT') plt.legend() plt.show() |
Run the code and this will be the result
Learn More on PyQt5
- How to Deploy PyQt5 Applications
- How to Integrate PyQt5 with OpenCV
- How to Use Stylesheets in PyQt5
- Learn PyQt5 Event Handling with Signals and Slots
- PyQt5 Tutorial: Creating Menus and Toolbars
- How to Open & Save Files in Python PyQt5
- PyQt5 Designer Tutorial: Complete Guide to Qt Designer
- PyQt5 vs Tkinter: Which GUI Library is Right for You
- How to Build Web Applications in PyQt5