In this PyQtGraph Tutorial we are going to learn Drawing Graphs in Python with PyQtGraph , we learn how you can install Pyqtgraph and how you can draw or plot different charts like scatter plot, bar graph and plotting curves.
What is PyQtGraph ?
PyQtGraph is a pure-python graphics and GUI library built on PyQt4/PyQt5/PySide/ PySide2 and numpy. It is intended for use in mathematics / scientific / engineering applications. Despite being written entirely in python, the library is very fast due to its heavy leverage of numpy for number crunching, Qt’s GraphicsView framework for 2D display, and OpenGL for 3D display.
Learn More on Python
- Python Top 5 Game Libraries
- Python GUI Development Libraries
- Web Development Libraries in Python
- How to Download Youtube Videos in Python
- Working with Python Pyglet Library
- Python Speech Recognition For Beginners
Installation
OK first of all you need to install PyQtGraph, you can use pip for the installation.
|
1 |
pip install pyqtgraph |
Drawing Line in PyQtGraph
OK now let’s draw a simple line Graphs in PyQtGraph, so this is the complete code for drawing line.
|
1 2 3 4 5 6 7 8 9 10 |
import sys from PyQt5.QtWidgets import QApplication import pyqtgraph as pg app = QApplication(sys.argv) pg.plot(x = [0, 5, 6, 2], y = [1, 9, 10, 15]) status = app.exec_() sys.exit(status) |
So these are the imports that you need, you can see that we have imported QApplication from PyQt5, also we need to pyqtgraph.
|
1 2 3 |
import sys from PyQt5.QtWidgets import QApplication import pyqtgraph as pg |
You need to create the object of QApplication, the sys.argv parameter is a list of arguments from a command line.
|
1 |
app = QApplication(sys.argv) |
You can use plot() function from pyqtgraph for plotting our line graph.
|
1 |
pg.plot(x = [0, 5, 6, 2], y = [1, 9, 10, 15]) |
We call app.exec_() to start up the event loop.
|
1 |
app.exec_() |
Run the complete code and this is the result.

PyQtGraph Plotting Scatter
OK now let’s plot scatter graph in PyQtGraph, so first of all what is scatter plot, a scatter plot is a two dimensional data visualization that uses dots to represent the values obtained for two different variables – one plotted along the x-axis and the other plotted along the y-axis. Scatter plots are used when you want to show the relationship between two variables. Scatter plots are sometimes called correlation plots because they show how two variables are correlated.
This is the complete code for drawing scatter plot.
|
1 2 3 4 5 6 7 8 9 10 11 12 13 14 |
import sys from PyQt5.QtWidgets import QApplication import pyqtgraph as pg import numpy as np app = QApplication(sys.argv) x = np.random.normal(size=500) y = np.random.normal(size=500) pg.plot(x, y, pen=None, symbol='o') status = app.exec_() sys.exit(status) |
OK for drawing scatter plot first you need to give your values, we are using random numbers from numpy library, and we give random values for the x and y positions.
|
1 2 |
x = np.random.normal(size=500) y = np.random.normal(size=500) |
After that we plot the scatter, using plot() function of pyqtgraph.
|
1 |
pg.plot(x, y, pen=None, symbol='o') |
Run the complete code and this is the result.

Plotting BarGraph in PyQtGraph
Let’s plot bargraphs in pyqtgraph, first of all what is BarGraph ? A bar graph is a pictorial rendition of statistical data in which the independent variable can attain only certain discrete values. The dependent variable may be discrete or continuous. The most common form of bar graph is the vertical bar graph, also called a column graph. In a vertical bar graph, values of the independent variable are plotted along a horizontal axis from left to right.
This is the code for creating bargraph.
|
1 2 3 4 5 6 7 8 9 10 11 12 13 14 15 16 17 18 19 20 21 22 23 24 25 26 27 28 29 30 31 32 33 34 35 36 37 38 39 40 41 |
import sys from PyQt5.QtWidgets import QApplication import pyqtgraph as pg import numpy as np app = QApplication(sys.argv) win = pg.plot() x = np.arange(10) y1 = np.sin(x) y2 = 1.1 * np.sin(x+1) y3 = 1.2 * np.sin(x+2) bg1 = pg.BarGraphItem(x=x, height=y1, width=0.3, brush='r') bg2 = pg.BarGraphItem(x=x+0.33, height=y2, width=0.3, brush='g') bg3 = pg.BarGraphItem(x=x+0.66, height=y3, width=0.3, brush='b') win.addItem(bg1) win.addItem(bg2) win.addItem(bg3) # Final example shows how to handle mouse clicks: class BarGraph(pg.BarGraphItem): def mouseClickEvent(self, event): print("clicked") bg = BarGraph(x=x, y=y1*0.3+2, height=0.4+y1*0.2, width=0.8) win.addItem(bg) status = app.exec_() sys.exit(status) |
In here we have created the object of QApplication and also Pyqtgraph.
|
1 2 |
app = QApplication(sys.argv) win = pg.plot() |
These are the data for BarGraph.
|
1 2 3 4 |
x = np.arange(10) y1 = np.sin(x) y2 = 1.1 * np.sin(x+1) y3 = 1.2 * np.sin(x+2) |
So in here we are going to create our BarGraph items.
|
1 2 3 |
bg1 = pg.BarGraphItem(x=x, height=y1, width=0.3, brush='r') bg2 = pg.BarGraphItem(x=x+0.33, height=y2, width=0.3, brush='g') bg3 = pg.BarGraphItem(x=x+0.66, height=y3, width=0.3, brush='b') |
Also in here we are going to add our BarGraph items to the window.
|
1 2 3 |
win.addItem(bg1) win.addItem(bg2) win.addItem(bg3) |
This is for handling mouse clicks for BarGraph items.
|
1 2 3 |
class BarGraph(pg.BarGraphItem): def mouseClickEvent(self, event): print("clicked") |
Run the complete code and this is the result.

Plotting Curves in PyQtGraph
In this section we want to draw curves in pyqtgraph, so this is the complete code.
|
1 2 3 4 5 6 7 8 9 10 11 12 13 14 15 |
import sys from PyQt5.QtWidgets import QApplication import pyqtgraph as pg import numpy as np app = QApplication(sys.argv) x = np.arange(1000) y = np.random.normal(size=(3, 1000)) plotWidget = pg.plot(title="GeeksCoders.com") for i in range(3): plotWidget.plot(x, y[i], pen=(i,3)) status = app.exec_() sys.exit(status) |
This is the plotting data, we are using numpy for creating the data in a range.
|
1 2 |
x = np.arange(1000) y = np.random.normal(size=(3, 1000)) |
In here we have given a title for the graph.
|
1 |
plotWidget = pg.plot(title="GeeksCoders.com") |
Run the code and this is the result.

Creating Legends in PyQtGraph
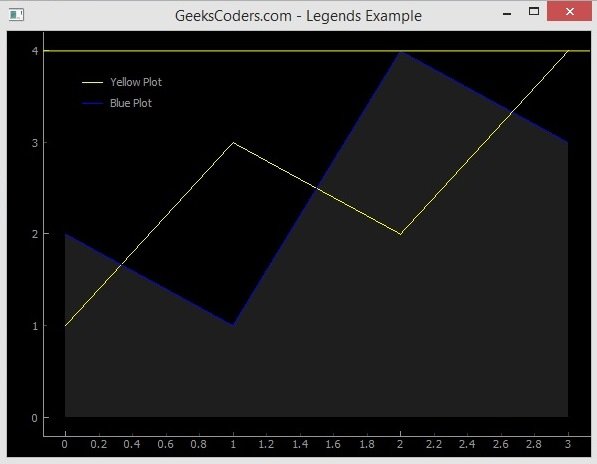
In this section we want to create legends, so first of all what are legends ? Legends are a useful way to label data series plotted on a graph. now this is the code for this example.
|
1 2 3 4 5 6 7 8 9 10 11 12 13 14 15 16 17 18 |
import sys from PyQt5.QtWidgets import QApplication import pyqtgraph as pg app = QApplication(sys.argv) plt = pg.plot() plt.setWindowTitle('GeeksCoders.com - Legends Example') plt.addLegend() c1 = plt.plot([1,3,2,4], pen='y', name='Yellow Plot') c2 = plt.plot([2,1,4,3], pen='b', fillLevel=0, fillBrush=(255,255,255,30), name='Blue Plot') c3 = plt.addLine(y=4, pen='y') status = app.exec_() sys.exit(status) |
In this code we have created pg.plot(), also we have given a title to our graph, after that we added the legend to our graph.
|
1 2 3 |
plt = pg.plot() plt.setWindowTitle('GeeksCoders.com - Legends Example') plt.addLegend() |
And these are our data that we want to plot.
|
1 2 3 |
c1 = plt.plot([1,3,2,4], pen='y', name='Yellow Plot') c2 = plt.plot([2,1,4,3], pen='b', fillLevel=0, fillBrush=(255,255,255,30), name='Blue Plot') c3 = plt.addLine(y=4, pen='y') |
Run the code and this is the result.