
In this article we want to cover Building Charts in Python: A Guide for Data Visualization in 2023. Data visualization is an important aspect of data analysis and understanding, and Python provides number of excellent libraries for building charts and graphs. whether you are working with data in a Jupyter notebook or building dashboard, charts and graphs can help you communicate your findings effectively. in this article we are going to cover some key concepts and tools you need to build charts in Python.
- Introduction to Matplotlib
Matplotlib is 2D plotting library for Python, and it’s one of the most widely used libraries for data visualization. Matplotlib provides large number of plotting functions and tools and it’s easy to use and flexible. you can build bar chart, line chart or scatter plot in Matplotlib, it means that it has all functionalities for creating charts.
- Seaborn: a high-level data visualization library
Seaborn is high-level data visualization library that is built on top of Matplotlib. Seaborn provides different functions for building charts and graphs, and it also provides number of beautiful and informative visualizations by default. Seaborn is great choice for exploratory data analysis and for building charts quickly and easily.
- Plotly: interactive and dynamic charts
Plotly is library for building interactive and dynamic charts, and it provides differemnt advanced features, such as animations, hover labels, and more. Plotly is great choice for building charts and graphs that you want to share and interact with, and it provides a number of excellent tools for publishing your charts online.
- Dash: building web-based dashboards
Dash is library for building web-based dashboards with Python, and it provides different tools for building charts, graphs, and other visualizations. Dash provides simple and intuitive environment for building interactive dashboards, and it provides a number of built-in components, such as dropdown menus, sliders and many more.
How to Install these Libraries
Installing the libraries mentioned above is straightforward process in Python. This is how you can install each one of them:
- Matplotlib: You can install Matplotlib by running the following command in your terminal or command prompt:
|
1 |
pip install matplotlib |
- Seaborn: You can install Seaborn by running following command in your terminal or command prompt, this command will install Seaborn library.
|
1 |
pip install seaborn |
- Plotly: You can install Plotly by running following command in your terminal or command prompt:
|
1 |
pip install plotly |
- Dash: You can install Dash by running following command in your terminal or command prompt:
|
1 |
pip install dash |
It’s important to note that these libraries will be installed in your system Python environment, so you will have access to them globally. if you’re working in virtual environment, you can install these libraries within that environment as well.
After installing these libraries, you can import them into your Python script and start using them for data visualization. you can also check official documentation for each library for more information on how to use them effectively.
These are a few examples of how you can use each of the libraries mentioned in the previous post:
- Matplotlib:
|
1 2 3 4 5 6 7 8 9 10 11 12 13 14 15 |
import matplotlib.pyplot as plt import numpy as np # Generating data for the chart x = np.linspace(0, 2 * np.pi, 100) y = np.sin(x) # Building the chart plt.plot(x, y) plt.xlabel("X Axis") plt.ylabel("Y Axis") plt.title("Sine Wave") # Showing the chart plt.show() |
Run the code this will be the result

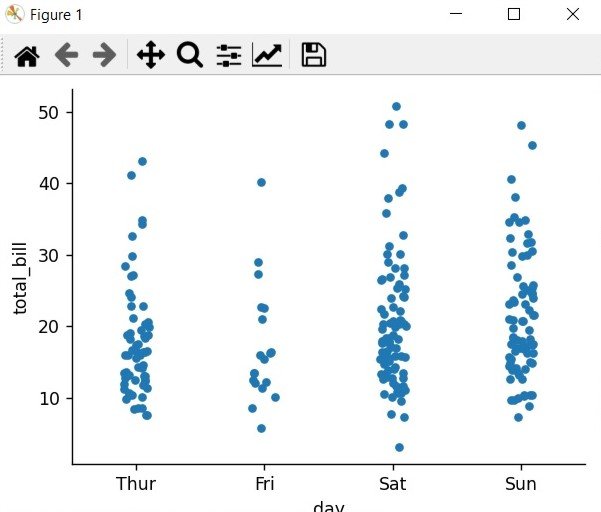
- Seaborn:
|
1 2 3 4 5 6 7 8 9 10 11 |
import seaborn as sns import matplotlib.pyplot as plt # Load tips dataset from seaborn library tips = sns.load_dataset("tips") # Building the chart sns.catplot(x="day", y="total_bill", data=tips) # Showing the chart plt.show() |
Run the code and this will be the result
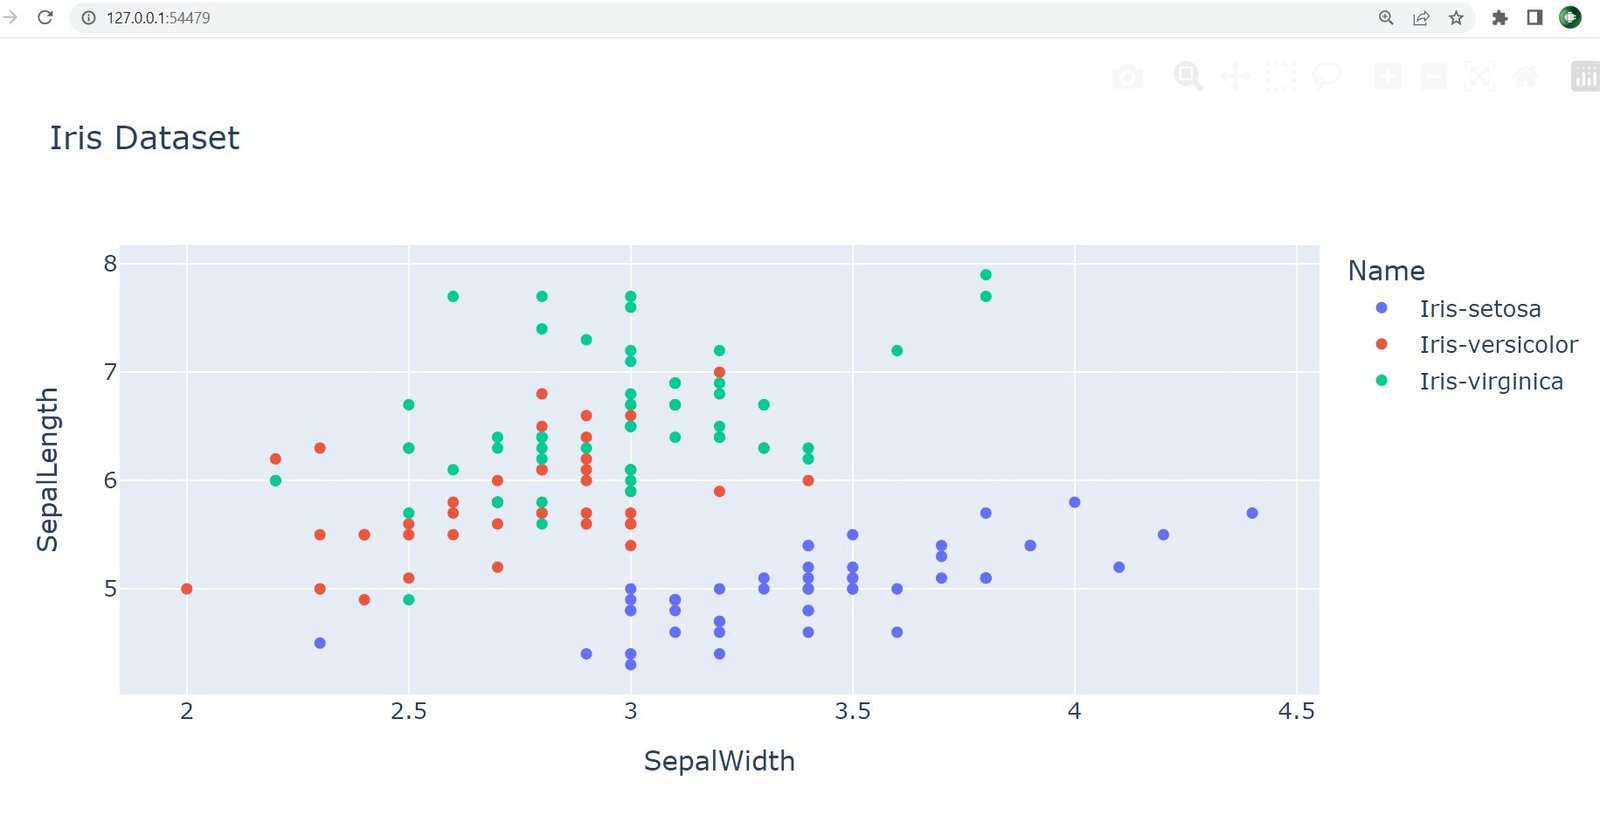
- Plotly:
|
1 2 3 4 5 6 7 8 9 10 11 |
import plotly.express as px import pandas as pd # Load iris dataset df = pd.read_csv("https://raw.githubusercontent.com/plotly/datasets/master/iris.csv") # Building the chart fig = px.scatter(df, x="SepalWidth", y="SepalLength", color="Name", title="Iris Dataset") # Showing the chart fig.show() |
Run the code and this will be the result
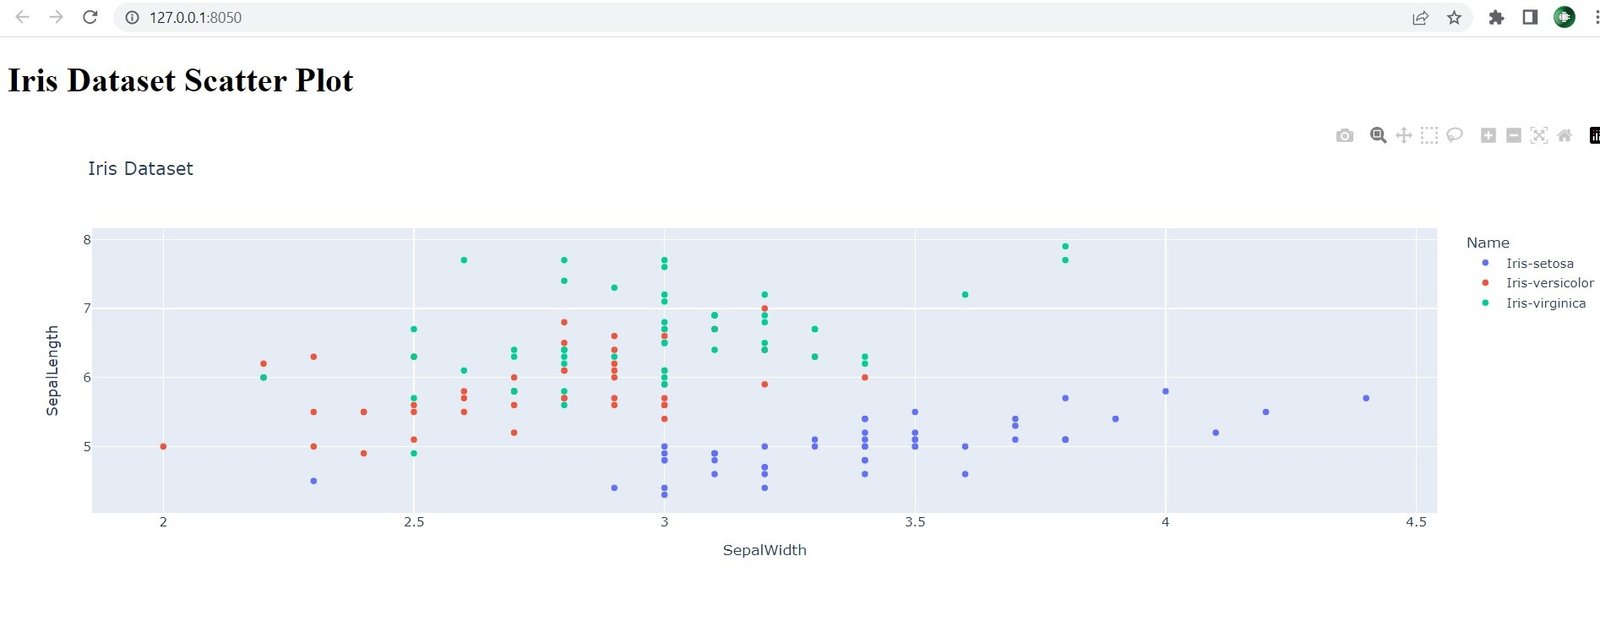
- Dash:
|
1 2 3 4 5 6 7 8 9 10 11 12 13 14 15 16 17 18 19 20 21 22 23 24 |
import dash import dash_core_components as dcc from dash import html import plotly.express as px import pandas as pd # Load iris dataset df = pd.read_csv("https://raw.githubusercontent.com/plotly/datasets/master/iris.csv") # Initialize the app app = dash.Dash() # Building the chart fig = px.scatter(df, x="SepalWidth", y="SepalLength", color="Name", title="Iris Dataset") # Define the layout app.layout = html.Div(children=[ html.H1(children="Iris Dataset Scatter Plot"), dcc.Graph(figure=fig) ]) # Run the app if __name__ == '__main__': app.run_server(debug=True) |
Run the code and this will be the result
Final Thoughts
these are some of the key concepts and tools you need to build charts in Python. Whether you’re working with data in a Jupyter notebook or building a dashboard, charts and graphs can help you communicate your findings effectively, and there are a number of excellent libraries available to help you get started. So why not start building your charts in Python today!”
-
Learn More on Python
- Get Started with wxPython: A Complete Guide to Building GUI Applications
- Python: The Most Versatile Programming Language of the 21st Century
- Tkinter: A Beginner’s Guide to Building GUI Applications in Python
- PySide6: The Cross-Platform GUI Framework for Python
- The Ultimate Guide to Kivy: Building Cross-Platform Apps with Python
- Discover the Power of Django: The Best Web Framework for Your Next Project
- How to Earn Money with Python
- Why Flask is the Ideal Micro-Web Framework
- Python Pillow: The Ultimate Guide to Image Processing with Python
- Get Started with Pygame: A Beginner’s Guide to Game Development with Python
- Python PyOpenGL: A Guide to High-Performance 3D Graphics in Python
- The Cross-Platform Game Development Library in Python
- Unleash the Power of Computer Vision with Python OpenCV
- PyQt6 Charts: An Overview and its Importance in Data Visualization
- Maximizing Your Productivity with Python and Excel