
In this lesson we want to talk about PyQt6 Charts: An Overview and its Importance in Data Visualization.
What is PyQt6 ?
PyQt6 is powerful and user friendly GUI toolkit for Python. it has easy to learn syntax and different features, PyQt6 is the perfect choice for developers looking to create stunning and functional user interfaces. in this article we are going to talk what makes PyQt6 the ultimate GUI toolkit for Python developers, and why it’s must have tool for your next project.
|
1 |
pip install PyQt6 |
PyQt6 Charts: An Overview and its Importance in Data Visualization
Data visualization is crucial aspect of decision making and understanding complex data sets. with advancement of technology the demand for more effective and user friendly tools for data visualization has increased. PyQt6 Charts is one of the tools that has become increasingly popular for its ability to create interactive, visually appealing charts and graphs.
PyQt6 Charts is Python library for creating charts and graphs. it is built on top of PyQt6 library, which provides different features for building desktop and mobile applications. PyQt6 Charts provides comprehensive set of charts and graphs, including line charts, bar charts, pie charts, histograms and scatter plots. the library also supports multiple series and legends, using PyQt6 charts it is easy to create complex visualizations.
One of the key advantages of using PyQt6 Charts is its simplicity. this library provides straightforward API and it is easy to get started, even for those without extensive programming experience. this library also provides many customization options, so that users can create charts that meet their specific needs.
Another advantage of PyQt6 Charts is its flexibility. this library supports both 2D and 3D charts, so users can choose the best format for their data. additionally this library provides supports for real time data that users can create dynamic charts that update in real time. this is particularly useful for visualizing data that changes frequently, such as stock prices or weather data.
PyQt6 Charts is also highly efficient and good. this library uses hardware acceleration for creating smooth and fast loading charts. even when working with large data sets. this makes it great choice for applications that needs to handle large amounts of data, such as financial or scientific applications.
In conclusion, PyQt6 Charts is powerful tool for data visualization. its simple, flexible and it has efficiency that makes it popular choice for both beginners and experienced developers. Whether you are looking to create interactive charts and graphs for your website or build data driven application, PyQt6 Charts is great and best choice for you.
How to Install PyQt6 Charts
To install PyQt6 Charts you can use following steps:
- Install PyQt6: PyQt6 Charts is built on top of PyQt6 library, so you will need to install PyQt6 first. you can install PyQt6 using pip package manager by running the following command in your terminal or command prompt:
|
1 |
pip install PyQt6 |
- Install PyQt6 Charts: After you have installed PyQt6, you can install PyQt6 Charts by running the following command:
|
1 |
pip install PyQt6-charts |
- Verify installation: To verify that PyQt6 Charts is installed correctly, you can run simple test program. this is an example of test program that creates simple line chart:
|
1 2 3 4 5 6 7 8 9 10 11 12 13 14 15 16 17 18 19 20 21 22 23 24 25 26 27 28 |
import sys from PyQt6.QtCharts import QChart, QChartView, QLineSeries from PyQt6.QtCore import Qt from PyQt6.QtGui import QPainter from PyQt6.QtWidgets import QApplication, QMainWindow app = QApplication(sys.argv) series = QLineSeries() series.append(0, 6) series.append(2, 4) series.append(3, 8) series.append(7, 4) chart = QChart() chart.addSeries(series) chart.createDefaultAxes() chart.setTitle("Simple line chart example") view = QChartView(chart) window = QMainWindow() window.setCentralWidget(view) window.resize(400, 300) window.show() sys.exit(app.exec()) |
Run the complete code and this will be the result.
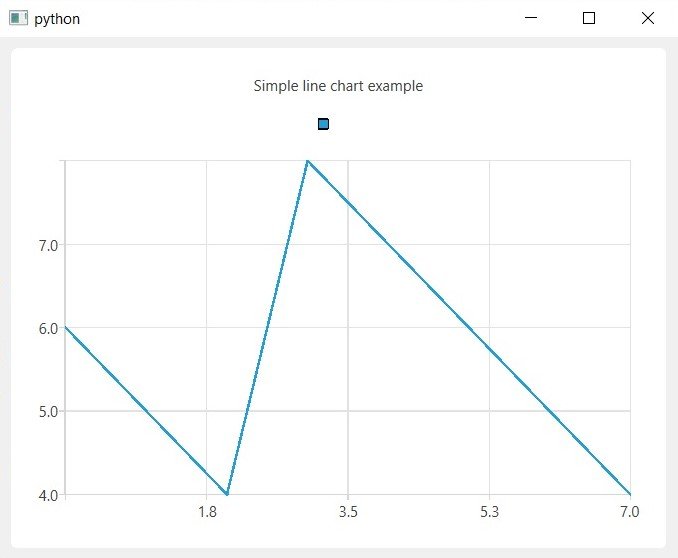
If the test program runs without any errors, it means that PyQt6 Charts is installed and ready to use.
Note: These instructions are for system running Python 3. if you are using different version of Python the installation steps may be slightly different.
This is an example of 6 different charts created using PyQt6 Charts, we are going to use tabs for our different charts.
|
1 2 3 4 5 6 7 8 9 10 11 12 13 14 15 16 17 18 19 20 21 22 23 24 25 26 27 28 29 30 31 32 33 34 35 36 37 38 39 40 41 42 43 44 45 46 47 48 49 50 51 52 53 54 55 56 57 58 59 60 61 62 63 64 65 66 67 68 69 70 71 72 73 74 75 76 77 78 79 80 81 82 83 84 85 86 87 88 89 90 91 92 93 94 95 96 97 98 99 100 101 102 103 104 105 106 107 108 109 110 111 112 113 114 115 116 117 118 119 120 121 122 123 124 125 126 127 128 129 130 131 132 133 134 135 136 137 138 139 140 141 142 143 144 |
import sys from PyQt6.QtCharts import QChart, QChartView, QLineSeries, QBarSeries, QBarSet, QPieSeries, QScatterSeries, \ QSplineSeries, QPercentBarSeries from PyQt6.QtCore import Qt from PyQt6.QtGui import QPainter from PyQt6.QtWidgets import QApplication, QMainWindow, QHBoxLayout, QTabWidget class ChartWindow(QMainWindow): def __init__(self): super().__init__() self.setWindowTitle("PyQt6 Charts Examples") self.setGeometry(100, 100, 800, 600) self.tabs = QTabWidget() self.setCentralWidget(self.tabs) self.line_chart = self.create_line_chart() self.bar_chart = self.create_bar_chart() self.pie_chart = self.create_pie_chart() self.scatter_chart = self.create_scatter_chart() self.spline_chart = self.create_spline_chart() self.percent_bar_chart = self.create_percent_bar_chart() self.tabs.addTab(self.line_chart, "Line Chart") self.tabs.addTab(self.bar_chart, "Bar Chart") self.tabs.addTab(self.pie_chart, "Pie Chart") self.tabs.addTab(self.scatter_chart, "Scatter Chart") self.tabs.addTab(self.spline_chart, "Spline Chart") self.tabs.addTab(self.percent_bar_chart, "Percent Bar Chart") def create_line_chart(self): series = QLineSeries() series.append(0, 6) series.append(2, 4) series.append(3, 8) series.append(7, 4) chart = QChart() chart.addSeries(series) chart.createDefaultAxes() chart.setTitle("Line Chart Example") view = QChartView(chart) return view def create_bar_chart(self): set1 = QBarSet("Data Set 1") set1.append(1) set1.append(2) set1.append(3) set2 = QBarSet("Data Set 2") set2.append(2) set2.append(3) set2.append(4) series = QBarSeries() series.append(set1) series.append(set2) chart = QChart() chart.addSeries(series) chart.createDefaultAxes() chart.setTitle("Bar Chart Example") view = QChartView(chart) return view def create_pie_chart(self): series = QPieSeries() series.append("Data 1", 1) series.append("Data 2", 2) series.append("Data 3", 3) chart = QChart() chart.addSeries(series) chart.setTitle("Pie Chart Example") view = QChartView(chart) return view def create_scatter_chart(self): series = QScatterSeries() series.append(0, 0) series.append(2, 2) series.append(4, 4) chart = QChart() chart.addSeries(series) chart.createDefaultAxes() chart.setTitle("Scatter Chart Example") view = QChartView(chart) return view def create_spline_chart(self): series = QSplineSeries() series.append(0, 6) series.append(2, 4) series.append(3, 8) series.append(7, 4) chart = QChart() chart.addSeries(series) chart.createDefaultAxes() chart.setTitle("Spline Chart Example") view = QChartView(chart) return view def create_percent_bar_chart(self): set1 = QBarSet("Data Set 1") set1.append(1) set1.append(2) set1.append(3) series = QPercentBarSeries() series.append(set1) chart = QChart() chart.addSeries(series) chart.createDefaultAxes() chart.setTitle("Percent Bar Chart Example") view = QChartView(chart) return view app = QApplication(sys.argv) window = ChartWindow() window.show() sys.exit(app.exec()) |
This is a brief explanation of each chart example in the code:
create_line_chart(): This function creates line chart. It createsQLineSeriesobject and adds three data points to it. chart’s title is set to “Line Chart Example”. chart view is returned from this function and will be displayed in tab in the main window.create_bar_chart(): This function creates bar chart. it createsQBarSeriesobject and adds bar set with three data points to it. chart’s title is set to “Bar Chart Example”. chart view is returned from this function and will be displayed in a tab in the main window.create_area_chart(): This function creates an area chart. it createsQAreaSeriesobject and adds twoQLineSeriesobjects to it. chart’s title is set to “Area Chart Example”. chart view is returned from this function and will be displayed in tab in the main window.create_pie_chart(): This function creates pie chart. it createsQPieSeriesobject and adds three data points to it. chart’s title is set to “Pie Chart Example”. The chart view is returned from this function and will be displayed in a tab in the main window.create_scatter_chart(): This function creates scatter chart. it createsQScatterSeriesobject and adds three data points to it. chart’s title is set to “Scatter Chart Example”. chart view is returned from this function and will be displayed in tab in the main window.create_spline_chart(): This function creates spline chart. it createsQSplineSeriesobject and adds four data points to it. chart’s title is set to “Spline Chart Example”. chart view is returned from this function and will be displayed in tab in the main window.create_percent_bar_chart(): This function creates percent bar chart. It createsQBarSetobject with three data points and adds it toQPercentBarSeriesobject. chart’s title is set to “Percent Bar Chart Example”. chart view is returned from this function and will be displayed in tab in the main window.
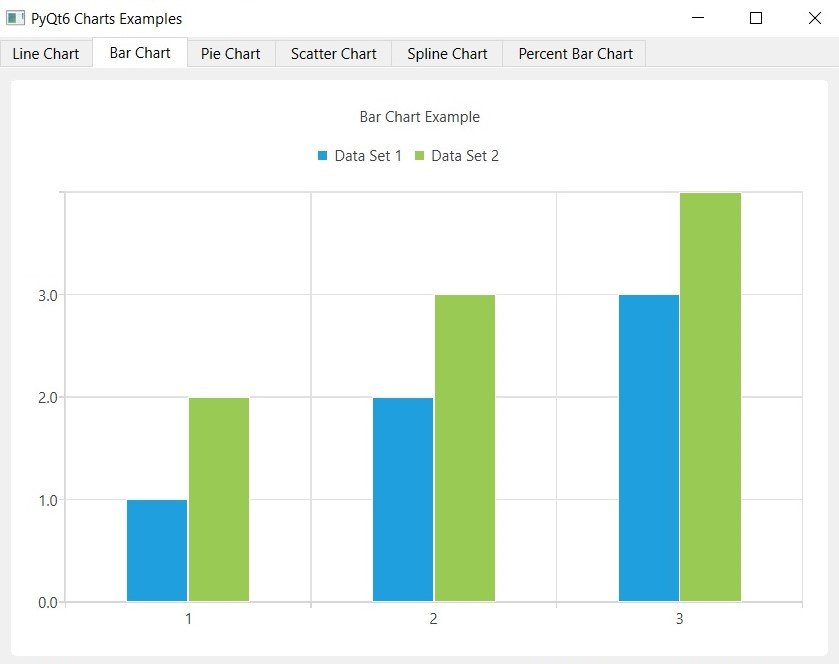
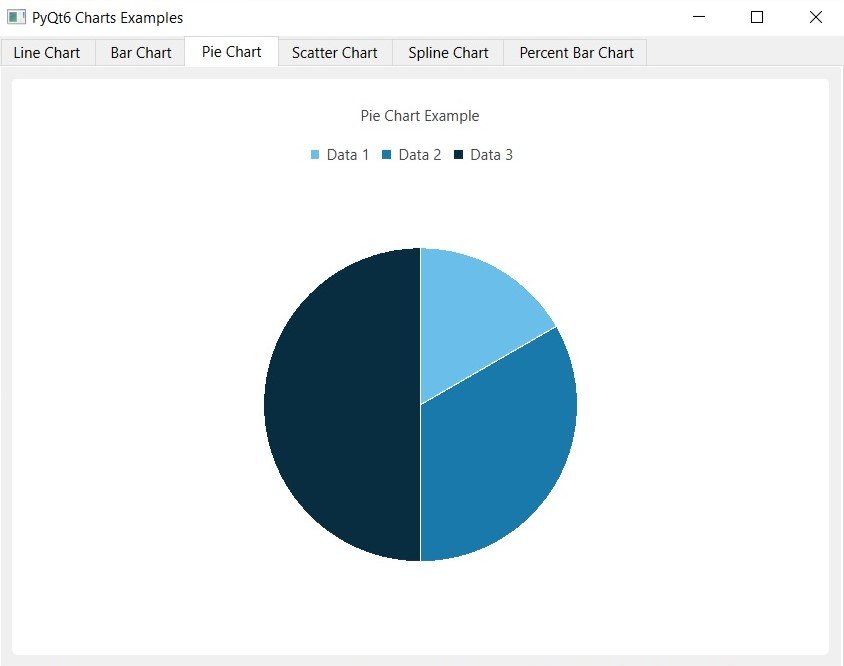
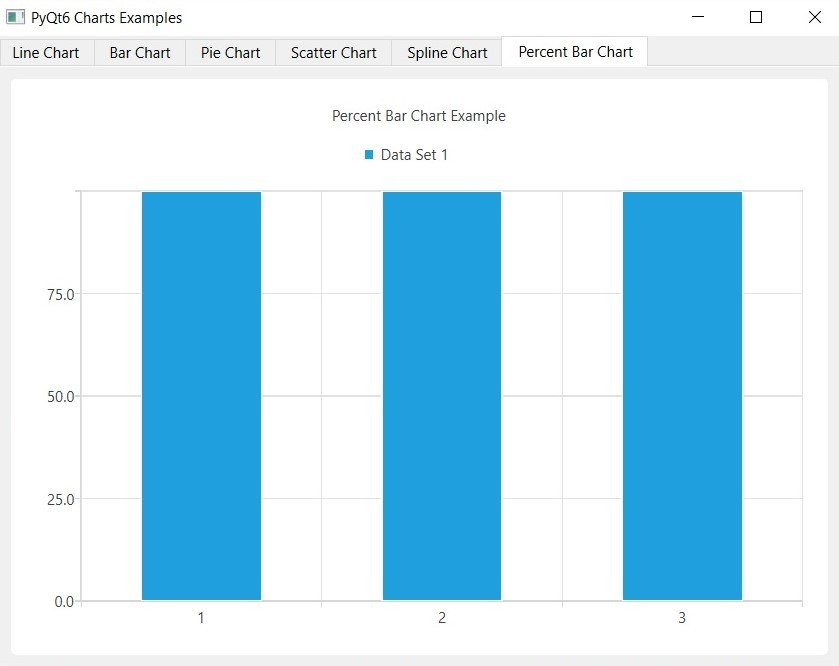
Run the complete code and you will different charts inside tabs, these are some images from the charts.
PyQt6 BarCharts
PyQt6 PieChart
PyQt6 Percent Chart
-
Learn More on Python
- Get Started with wxPython: A Complete Guide to Building GUI Applications
- Python: The Most Versatile Programming Language of the 21st Century
- Tkinter: A Beginner’s Guide to Building GUI Applications in Python
- PySide6: The Cross-Platform GUI Framework for Python
- The Ultimate Guide to Kivy: Building Cross-Platform Apps with Python
- Discover the Power of Django: The Best Web Framework for Your Next Project
- How to Earn Money with Python
- Why Flask is the Ideal Micro-Web Framework
- Python Pillow: The Ultimate Guide to Image Processing with Python
- Get Started with Pygame: A Beginner’s Guide to Game Development with Python
- Python PyOpenGL: A Guide to High-Performance 3D Graphics in Python
- The Cross-Platform Game Development Library in Python
- Unleash the Power of Computer Vision with Python OpenCV
