In this Python article we want to learn How to Find Microsoft Stock Price with Python, as Python developer, you may want to access real time financial data for different purposes such as stock analysis, portfolio management or trading. in this article we want to learn how to use Python to retrieve current stock price of Microsoft (MSFT) using yfinance library.
How to Find Microsoft Stock Price with Python
First of we need to install yfinance library and you can use pip for that
|
1 |
pip install yfinance |
Now this is the complete code for this article
|
1 2 3 4 5 6 7 8 9 10 11 12 13 |
import yfinance as yf # creat Ticker object for Microsoft with the ticker symbol MSFT msft = yf.Ticker("MSFT") # retrieve historical market data for stock for one day data = msft.history(period="1d") # extract last available closing price of stock price = data["Close"].iloc[-1] # print stock pric print("Microsoft stock price is currently:", price) |
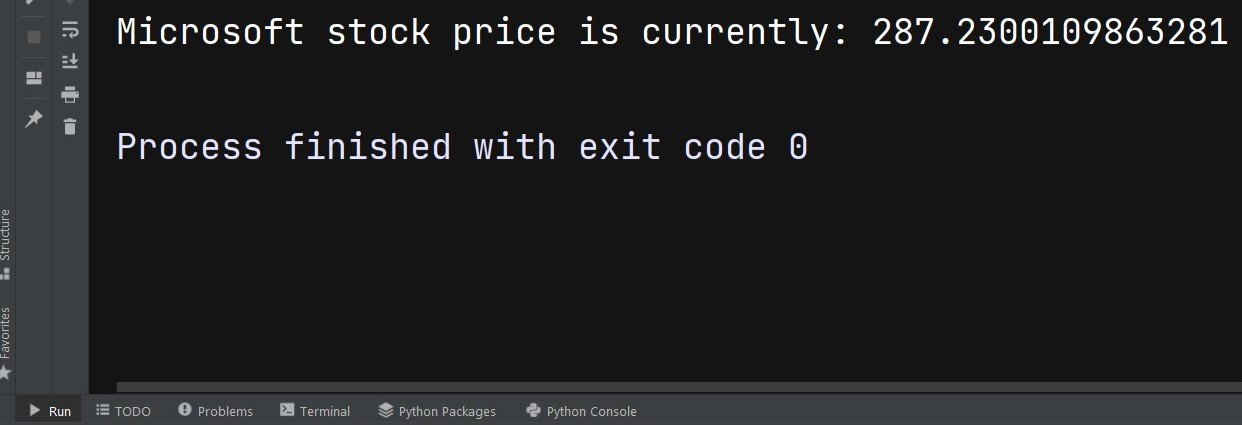
When you run this code, it will print the current stock price of Microsoft to the console. Note that the stock price may be different throughout the day, so this price may not be up to date by the time you see it.
So this is the result by the time
You can modify the code to display more data from the historical market data. this is an example that retrieves the data for the past 5 days and displays Open, High, Low and Close prices for each day:
|
1 2 3 4 5 6 7 8 9 10 11 12 13 14 15 16 |
import yfinance as yf # create Ticker object for Microsoft with ticker msft = yf.Ticker("MSFT") # retrieve historical market data for stock for past 5 days data = msft.history(period="5d") # print Open, High, Low and Clos prices for each day for i in range(len(data)): date = data.index[i].strftime("%Y-%m-%d") open_price = data["Open"].iloc[i] high_price = data["High"].iloc[i] low_price = data["Low"].iloc[i] close_price = data["Close"].iloc[i] print(f"{date} - Open: {open_price:.2f}, High: {high_price:.2f}, Low: {low_price:.2f}, Close: {close_price:.2f}") |
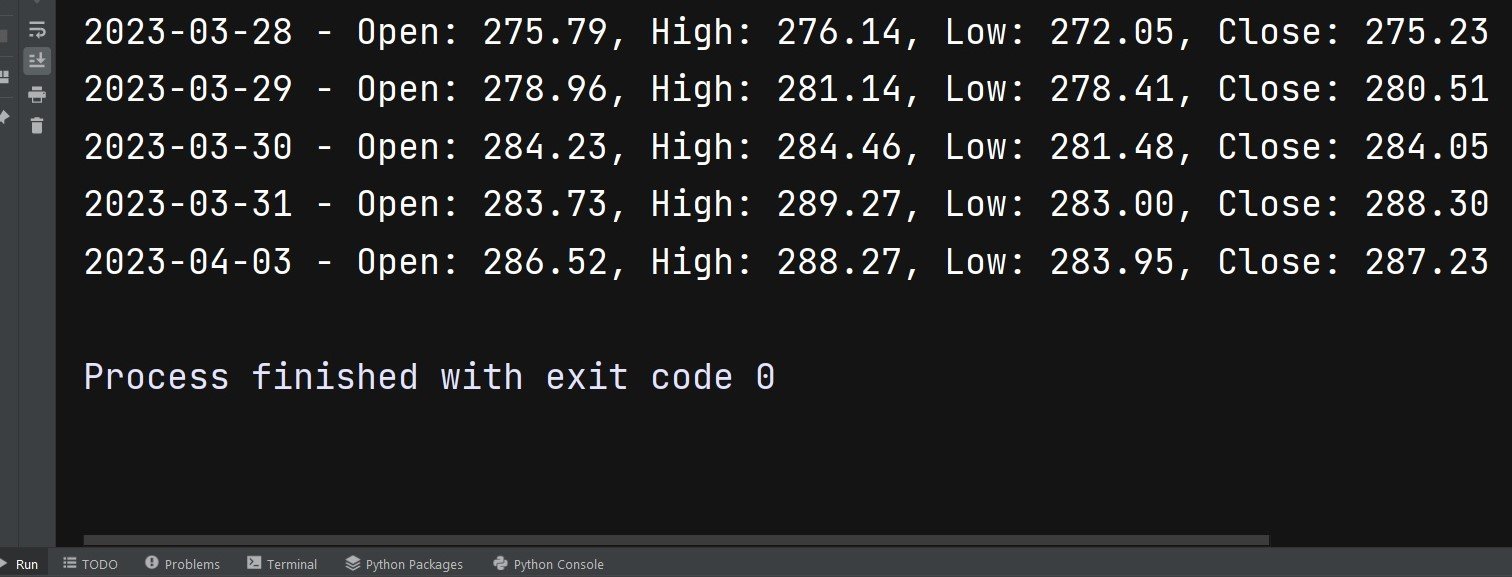
This code retrieves historical market data for the past 5 days using history() function. after that it uses for loop to iterate through the data and extract the Open, High, Low and Close prices for each day. strftime() function is used to format the date in more readable format. and at the end prices are printed to the console using formatted strings.
This will be the result
Learn More on Python GUI
- How to Create Print Dialog in PySide6
- How to Create Button in Python & PySide6
- How to Use Qt Designer with PySide6
- How to Add Icon to PySide6 Window
- How to Load UI in Python PySide6
- How to Create RadioButton in PySide6
- How to Create ComboBox in PySide6
- How to Create CheckBox in Python PySide6
- Responsive Applications with PyQt6 Multithreading
- Event Handling in Python and PyQt6
- How to Use Stylesheets in Python PyQt6